Trade Overview
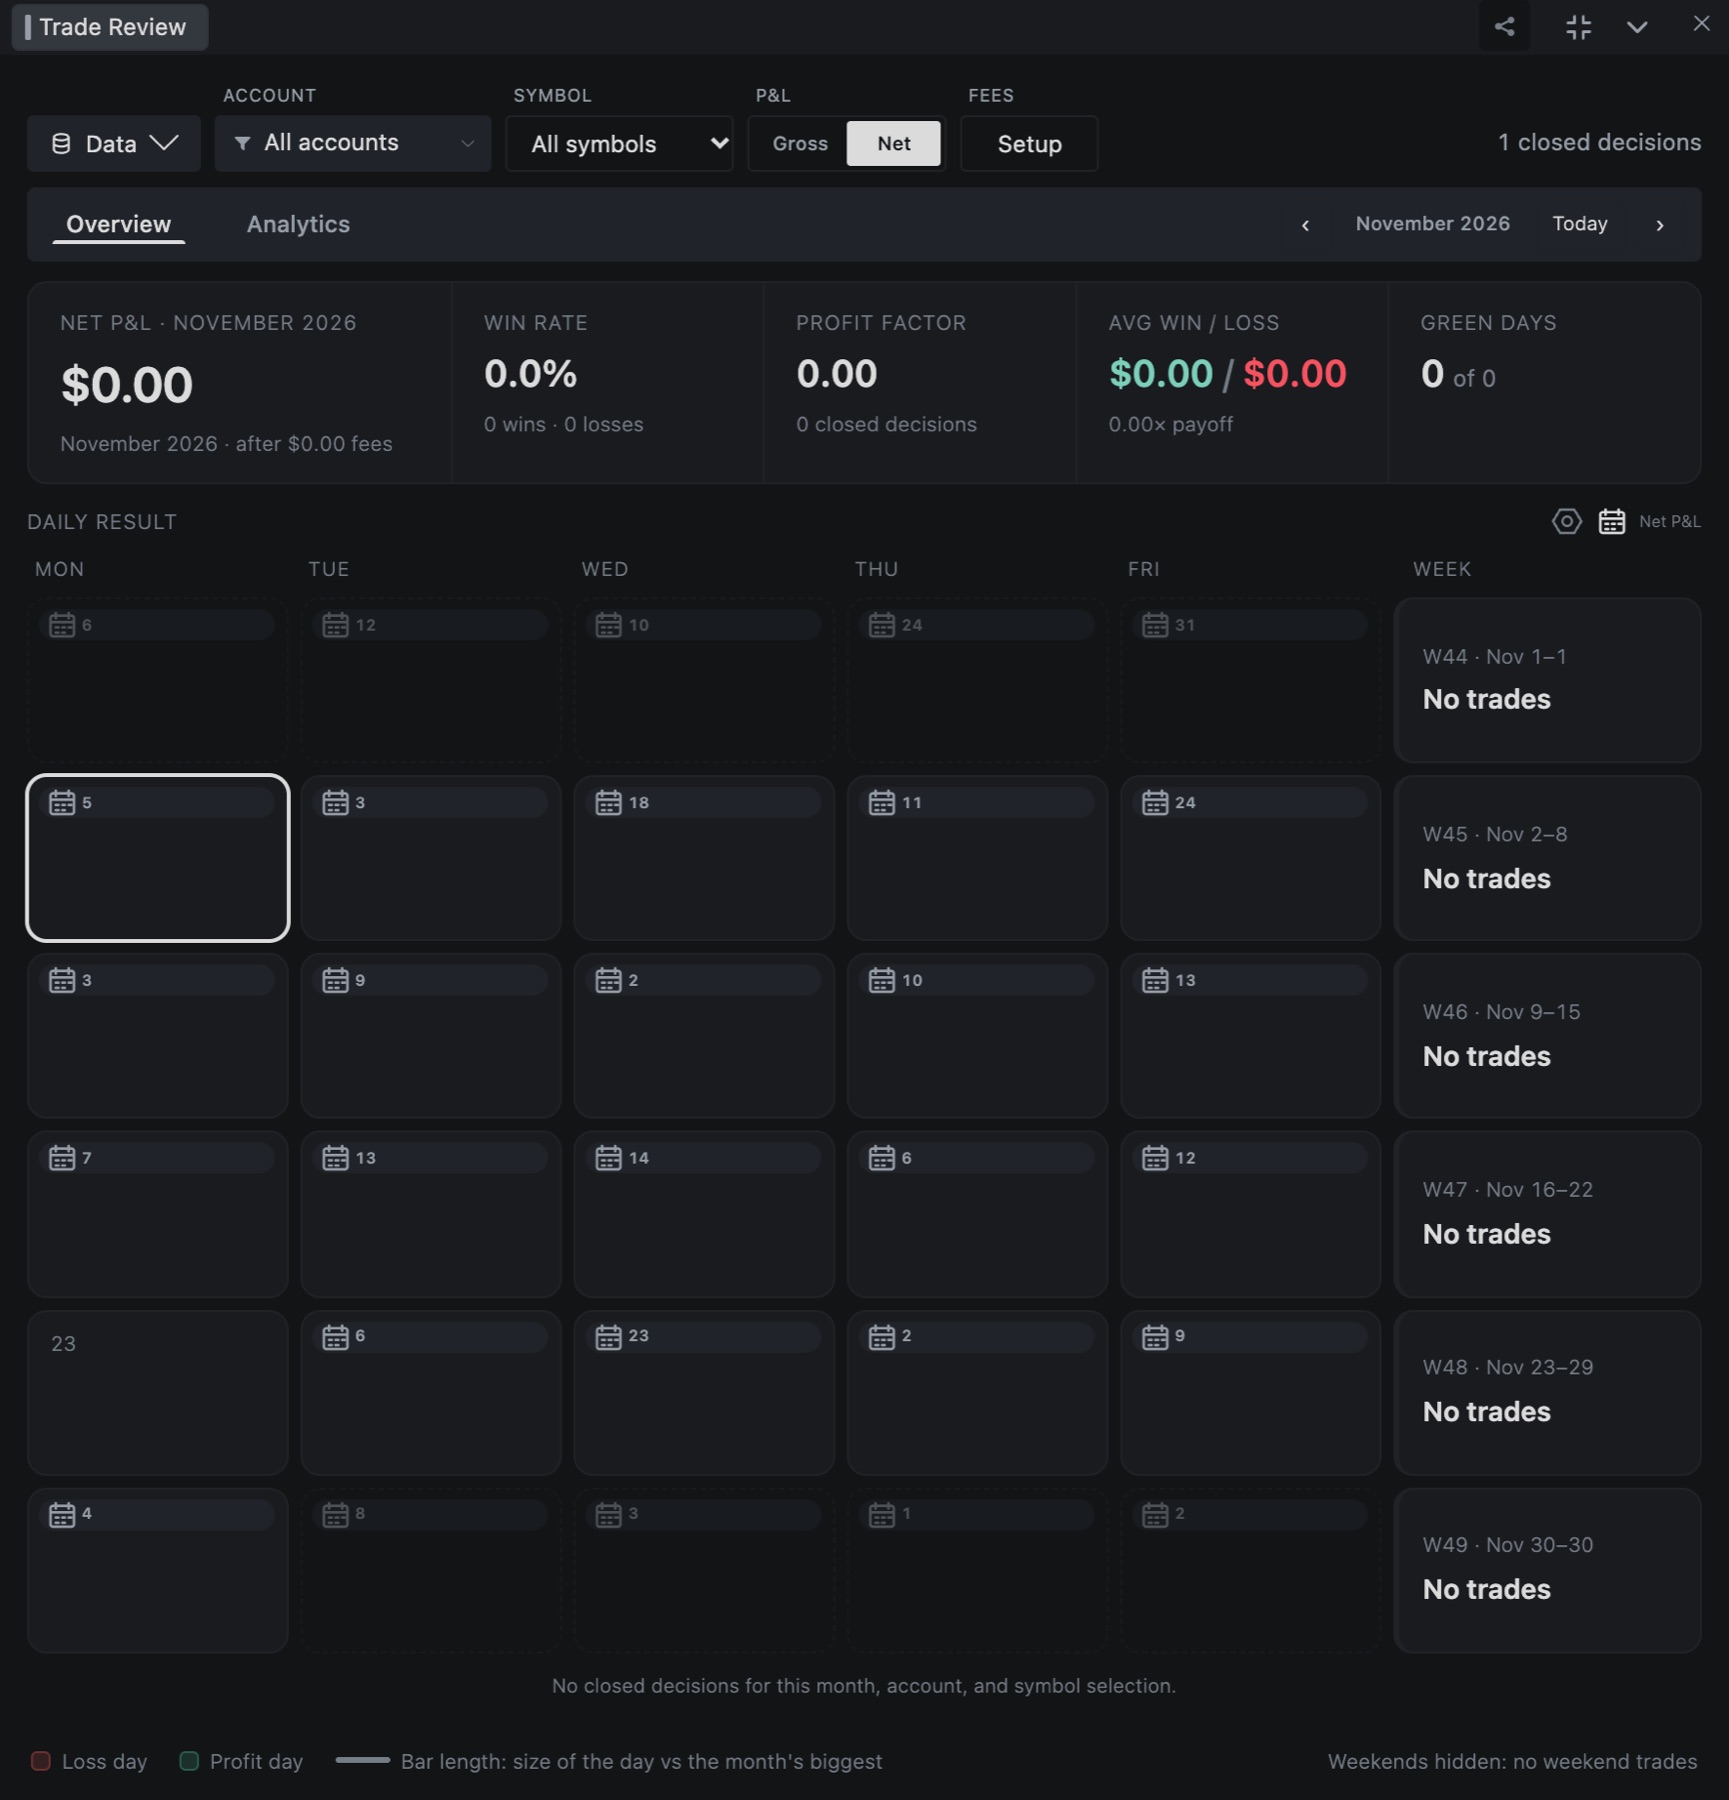
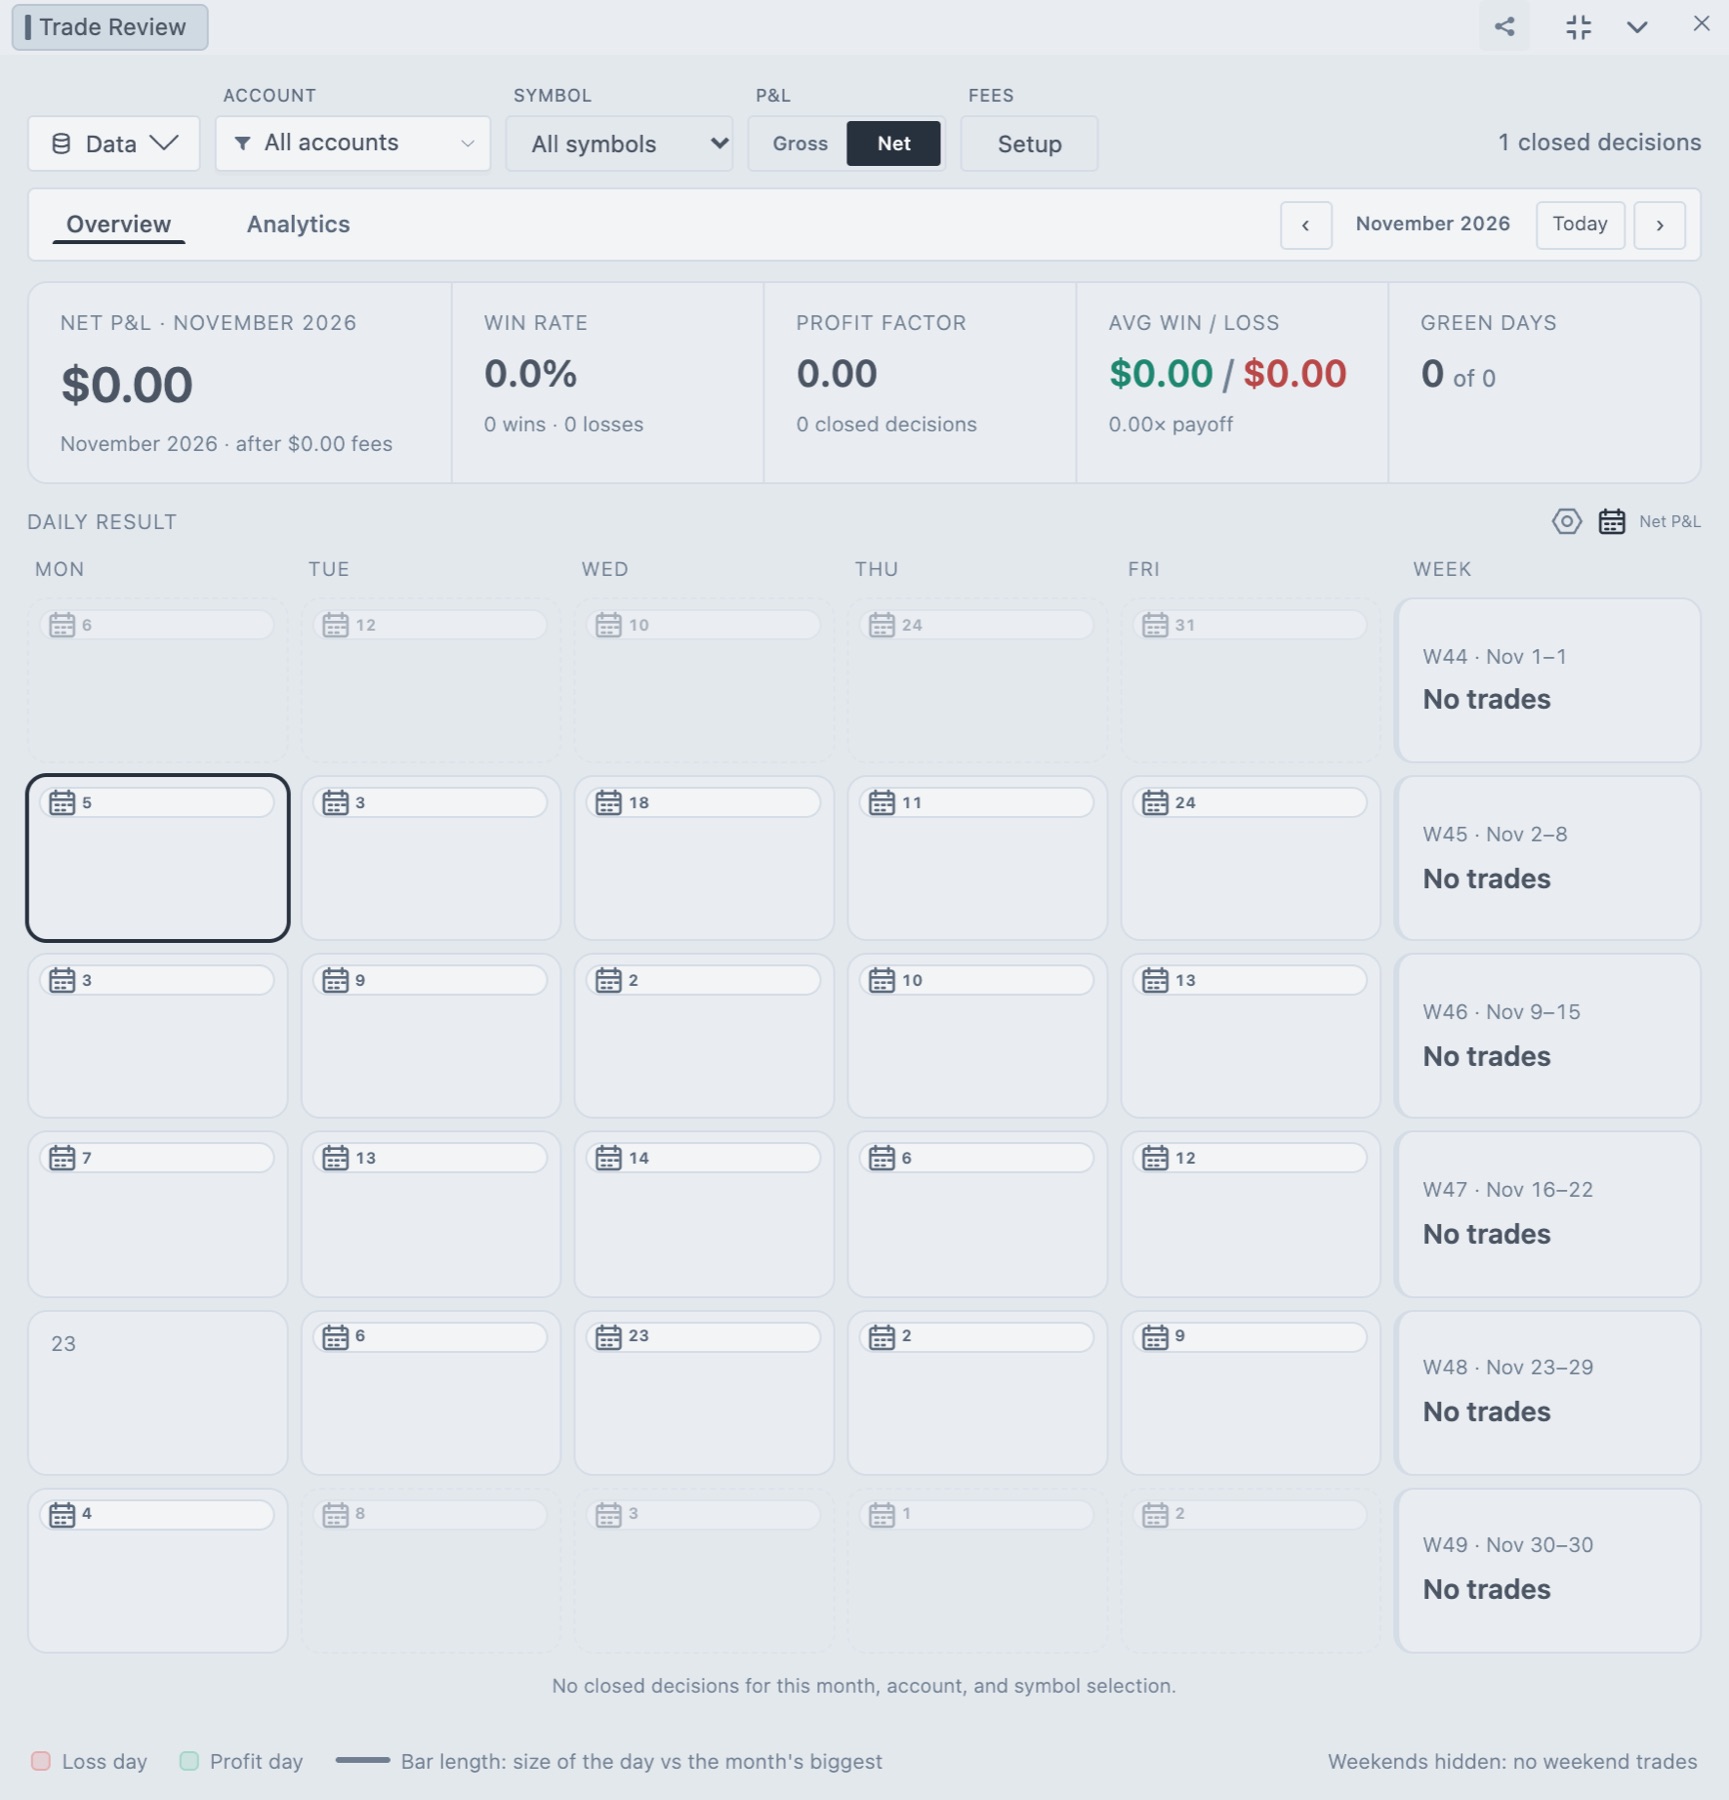
Trade Overview shows your closed trades as a month. The calendar has each day's result, and a row of numbers gives your win rate, profit factor, average win and loss, and green days.
Open Trade Overview
- In the top bar, click +.
- Click Trade Overview.
You can only have one Trade Overview open. Click the menu item again to close it. If you have no trades yet, the window shows an example month marked Sample. Click Hide sample to remove it. Your own trades replace the sample after you sync or import.
What counts as a trade
Tradrr counts a closed decision. A decision starts when your position leaves flat and ends when it's flat again. If you scale in and out in between, it's still one decision. The count at the top left, like 37 closed decisions, is how many decisions are loaded. A decision belongs to the trading day it closed on, using the futures trading date. An exit on Sunday evening counts for Monday.
Load your trades
Click Data in the toolbar. You get these choices.
| Choice | What it does |
|---|---|
| Sync today (or Sync and the month name) | Pulls fills from your connected Rithmic accounts for the current session, or for the month you're viewing. It needs a Rithmic connection. |
| Import CSV | Adds fills from a file. See Import trades from CSV. |
| Load demo month | Replaces the view with example trades. |
Once you're connected, Tradrr syncs automatically and shows Synced automatically. Trades from Replay and SIM accounts show up after you close a position, and they only last for the session.
Filter the view
| Control | What it does |
|---|---|
| Account | Pick which accounts count. Each account shows its status: Connected, Saved or Imported. Connected accounts have Refresh. Saved ones have Remove, which deletes the saved history from this device after you confirm. |
| Symbol | Show one market or All symbols. |
| P&L | Switch between Gross (before fees) and Net (after fees). See Commissions and fees. |
| Fees | Opens Setup for your fee rates. |
Use the arrows next to the month name to change month. Today takes you back to the current month.
Overview tab
The numbers
| Number | How it's worked out |
|---|---|
| Net P&L or Gross P&L | The total result for the month, with the fees shown beneath it. |
| Win rate | Winning decisions divided by all decisions. It also shows the number of wins and losses. |
| Profit factor | Total won divided by total lost. Above 1.00 means your winners outweigh your losers. With no losing decisions it shows an infinity sign. |
| Avg win / loss | The average winning decision and the average losing decision. The line beneath shows the payoff: average win divided by average loss. |
| Green days | Days with a positive result, out of the days you traded, with a strip of one block per day. |
The calendar
Each traded day shows its result and a bar. The bar length compares the day with the biggest day of the month. A day can also show its trade count and win rate. Click the gear icon above the calendar to switch Trade count and Win rate on or off. The Week column on the right adds up each week.
- Click a day to open it in Review + Tradrr AI.
- Click the calendar icon above the grid to show or hide high-impact economic events on the days they happened. Click the badge on a day to see each event's time, country, importance, previous and actual value.
- Weekend columns only show up when you traded on a weekend.
When one day is far bigger than the rest of the month, a banner tells you to check the fills and contract size, with an Open day link. It's there to catch a bad import.
Analytics tab
The Analytics tab gives more detail for the month and the filters you picked.
- Charts. An equity curve with drawdown from peak, and a win rate and payoff chart.
- Setup performance. Trades, win rate and result for each setup tag. Until you've tagged some decisions, Tradrr suggests tagging five with a setup to start comparing.
- Performance patterns. Two scatter plots, Duration vs P&L and Exit time vs P&L, with one point per decision.
- Closed trades. A table with the close time, account, symbol, side, quantity, entry, exit, fees and result. Click + Tag trade in the last column to tag a trade with a setup, a session and any mistakes.
Share the month
Click the share icon in the window header (Share monthly review) to make a PNG of the month's totals. The image never includes account names or numbers.
Tip. Account labels follow your Account labels setting. Pick a masked style before you share a screenshot.
Related articles
Was this article helpful?