Every window, every indicator, explained.
Setup, trading and settings, step by step.
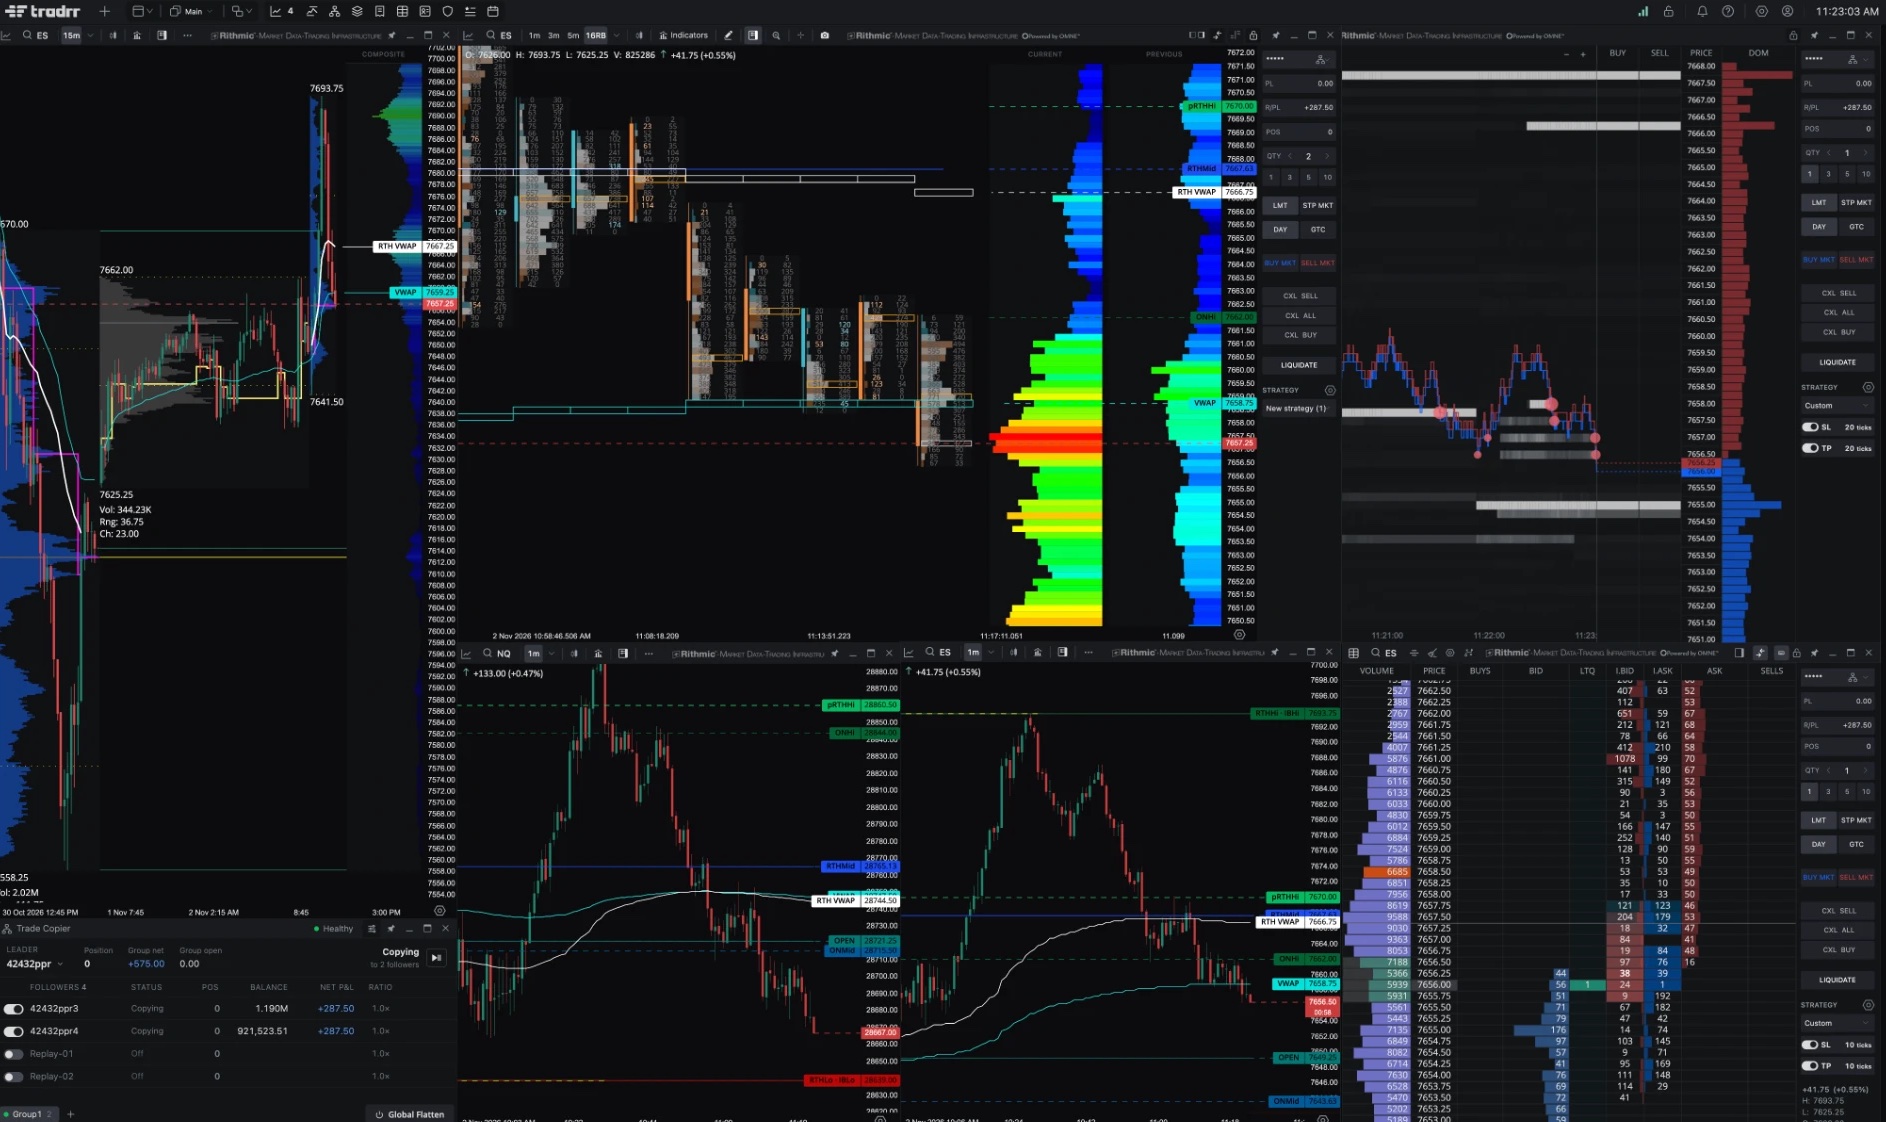
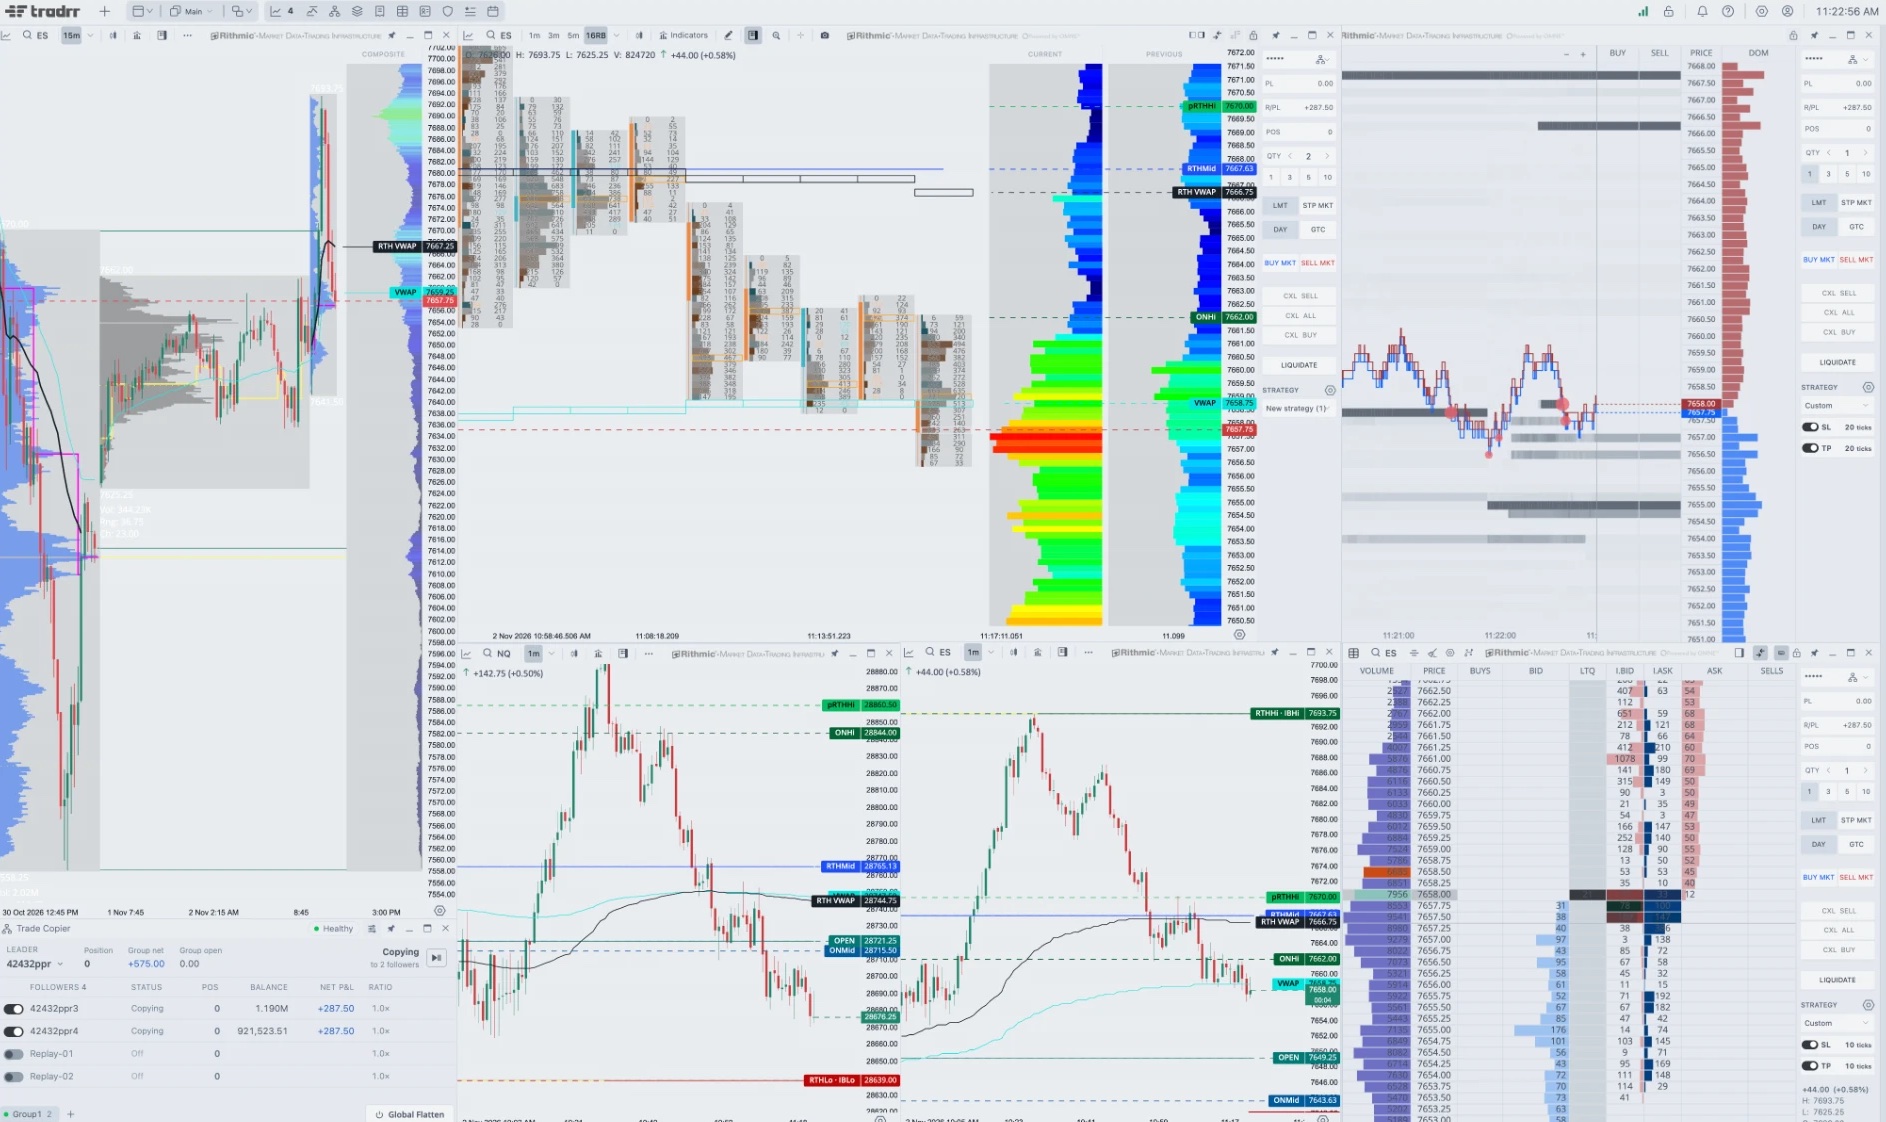
New to Tradrr? Start here
Four steps take you from installing the app to placing your first practice trade.
Install and sign in
Use the web app or install the desktop app. Then pick a starter workspace.
STEP 2Connect your data
Sign in to Rithmic with your broker or prop firm account, or start a SIM account.
STEP 3Practice on Market Replay
Replay recorded sessions at any speed and trade them with a practice account.
STEP 4Place your first order
Learn the DOM: columns, quantity, brackets and one-click orders.
Browse by topic
Every area of the platform has its own section. The bar shows how many articles each section has.
Getting started
Connections
Market Replay
Workspaces and windows
Chart
DOM and order entry
Risk and copying
Trade review
Indicator library
Each indicator has its own page: what it shows, every setting, and how traders read it.
Footprint
Footprint shows the bid and ask volume traded at every price inside each bar, with imbalance highlights, point of control and delta.
Order flowVolume Profile
Volume Profile draws a histogram of volume at each price for every day or period, with the point of control and value area.
Volume and profileComposite Profile
Composite Profile merges the volume of the loaded bars into one profile docked at the chart edge, with POC and value area lines.
Volume and profileVWAP
VWAP is the volume-weighted average price. Tradrr draws one line for the full trading day and one for regular trading hours, with optional bands.
Volume and profileVolume
Volume shows the number of contracts traded in each bar as columns in a panel below the price chart.
Volume and profileVolume Breakdown
Volume Breakdown plots delta, delta bars, delta momentum, buy volume or sell volume per bar, optionally accumulated over a session, week or month.
Order flowBig Trades
BetaBig Trades draws circles on the chart at prices where a bar traded large size, sized by volume and colored by side. Beta.
Order flowBar Stats
Bar Stats adds a table under the chart with volume, delta, ticks and related figures for every bar, in the rows and colors you choose.
Order flowSession Stats
Session Stats draws labelled lines for the RTH, overnight, initial balance and previous-session highs, lows and mids.
Session levelsPrice Stats
Price Stats adds compact volume profile columns for the current session, the previous session and the last several days.
Volume and profileOpening Range
Opening Range marks the high and low of the first minutes after the session opens, with optional midpoint and target lines.
Session levelsOpening Type
Opening Type classifies how the regular session opened and shows an info box with a likely path, confirmation, invalidation and objectives.
Session levelsMoving averages
The Moving Average group has 15 indicators that smooth price or volume. This page lists each one and shows how to add and set it up.
Trend and structureOscillators
The Oscillator group has 28 indicators for momentum, volatility and overbought or oversold readings. This page lists each one and shows how to add it.
Trend and structureRegression
The Regression group has four indicators that fit a straight line to recent prices: forecast, R2, intercept and slope.
Trend and structureZoneDecoder AI
Add-onZoneDecoder AI is a paid add-on that draws AI reaction zones on your chart, each with a confidence percentage.
Add-onsStill stuck?
Live support
Click the ? in the top bar and pick Get live support to chat with us right in the app.
Support tickets
Same menu, Support tickets. Create a ticket or check the ones you've got open.
Send feedback
Found a bug? Send feedback in that menu sends your report with app diagnostics attached.