Sync time and price across charts
Sync crosshair across charts draws a line on every other chart that marks where your cursor is on the chart you're pointing at. Use it to compare the same moment on a 1-minute chart, a 5-minute chart and a chart of another market.
How it works
- Time. Point at a bar on one chart. Every other chart in the workspace shows a vertical line at the same time, whatever its interval.
- Price. If another chart shows the same instrument, it also shows a horizontal line at the price under your cursor, with price labels on the scale. Charts of other instruments only show the time line, because a price on ES means nothing on NQ.
- Where the price line appears. The price line follows your cursor only while it's in the main price panel of the chart, not in an indicator panel below it.
The chart under your cursor doesn't draw the synced lines. It shows its own crosshair as usual. The synced lines disappear when your cursor leaves the chart, and while a chart is still loading.
The lines also show on charts you've moved into a separate Tradrr browser window, as long as that window is in the same browser as the one you're pointing in.
Charts on tick, volume or range bars
Chart types like tick, volume and range don't use a fixed time per bar. On those, Tradrr marks the bar that contains the time you're pointing at. If that time is earlier than the first bar the chart has loaded, the chart draws no line.
Turn it on or off
The setting is saved per workspace. It's on by default, including for workspaces you created before the option existed.
- In the top bar, click the Workspaces button.
- Click Sync crosshair across charts. A check mark means it's on.
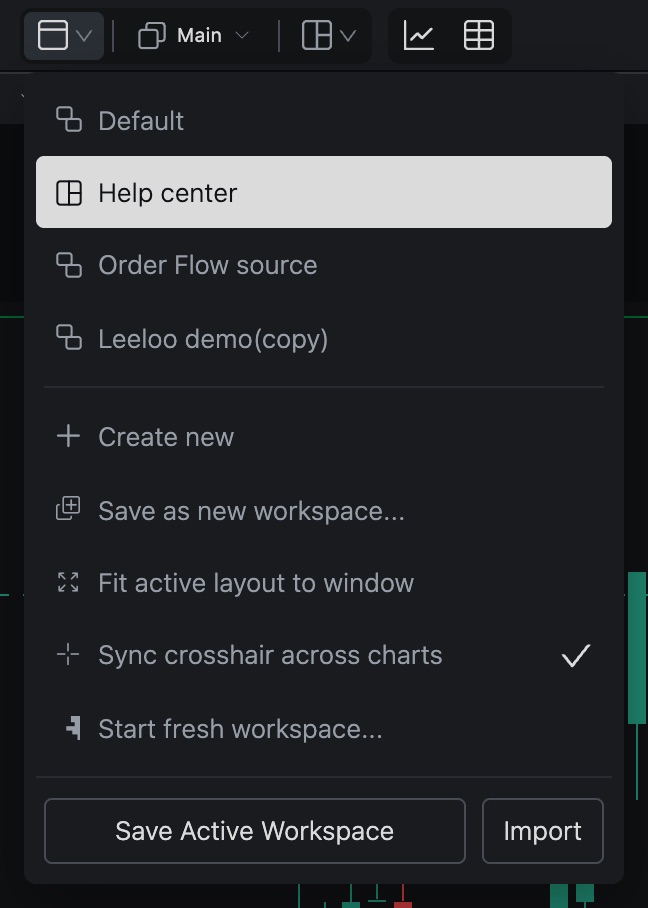
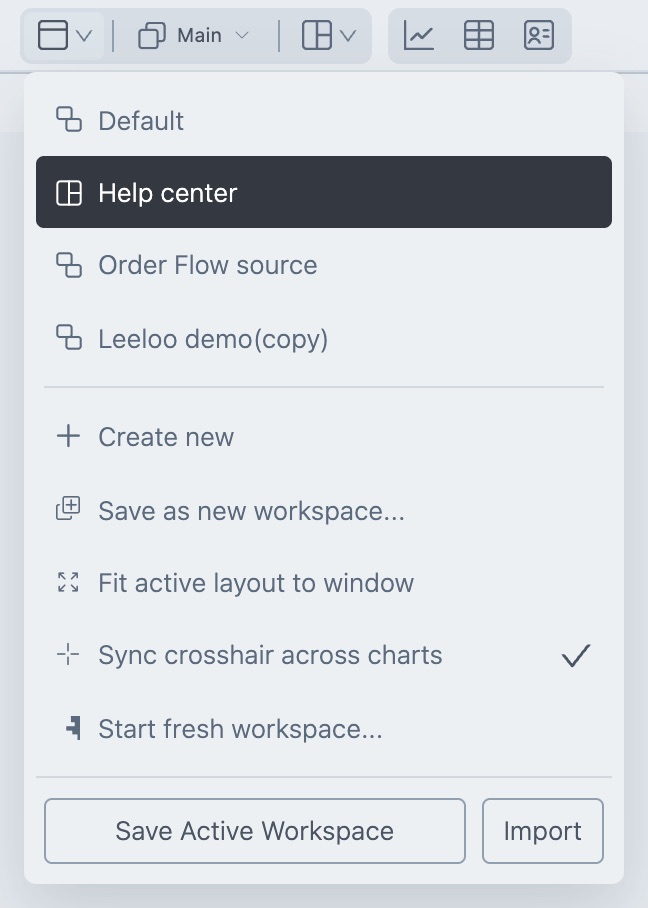
Point at the item to read its tooltip: Synchronize time across charts and price for matching instruments.
Ways to use it
- Open two charts of the same instrument on different intervals. Point at a swing on the 5-minute chart and see exactly which bar it falls on in the 1-minute chart.
- Open ES and NQ side by side. Point at a turn in one and see whether the other turned at the same time.
Related articles
Was this article helpful?