Chart settings
Chart settings cover colors, scales, what the chart shows for your orders and positions, and the trade panel layout. They belong to the chart you open them from.
Open chart settings
- Right-click an empty part of the chart.
- Choose Settings....
- Click a section on the left: General, Chart Trading, Trading Hours or Value Scale.
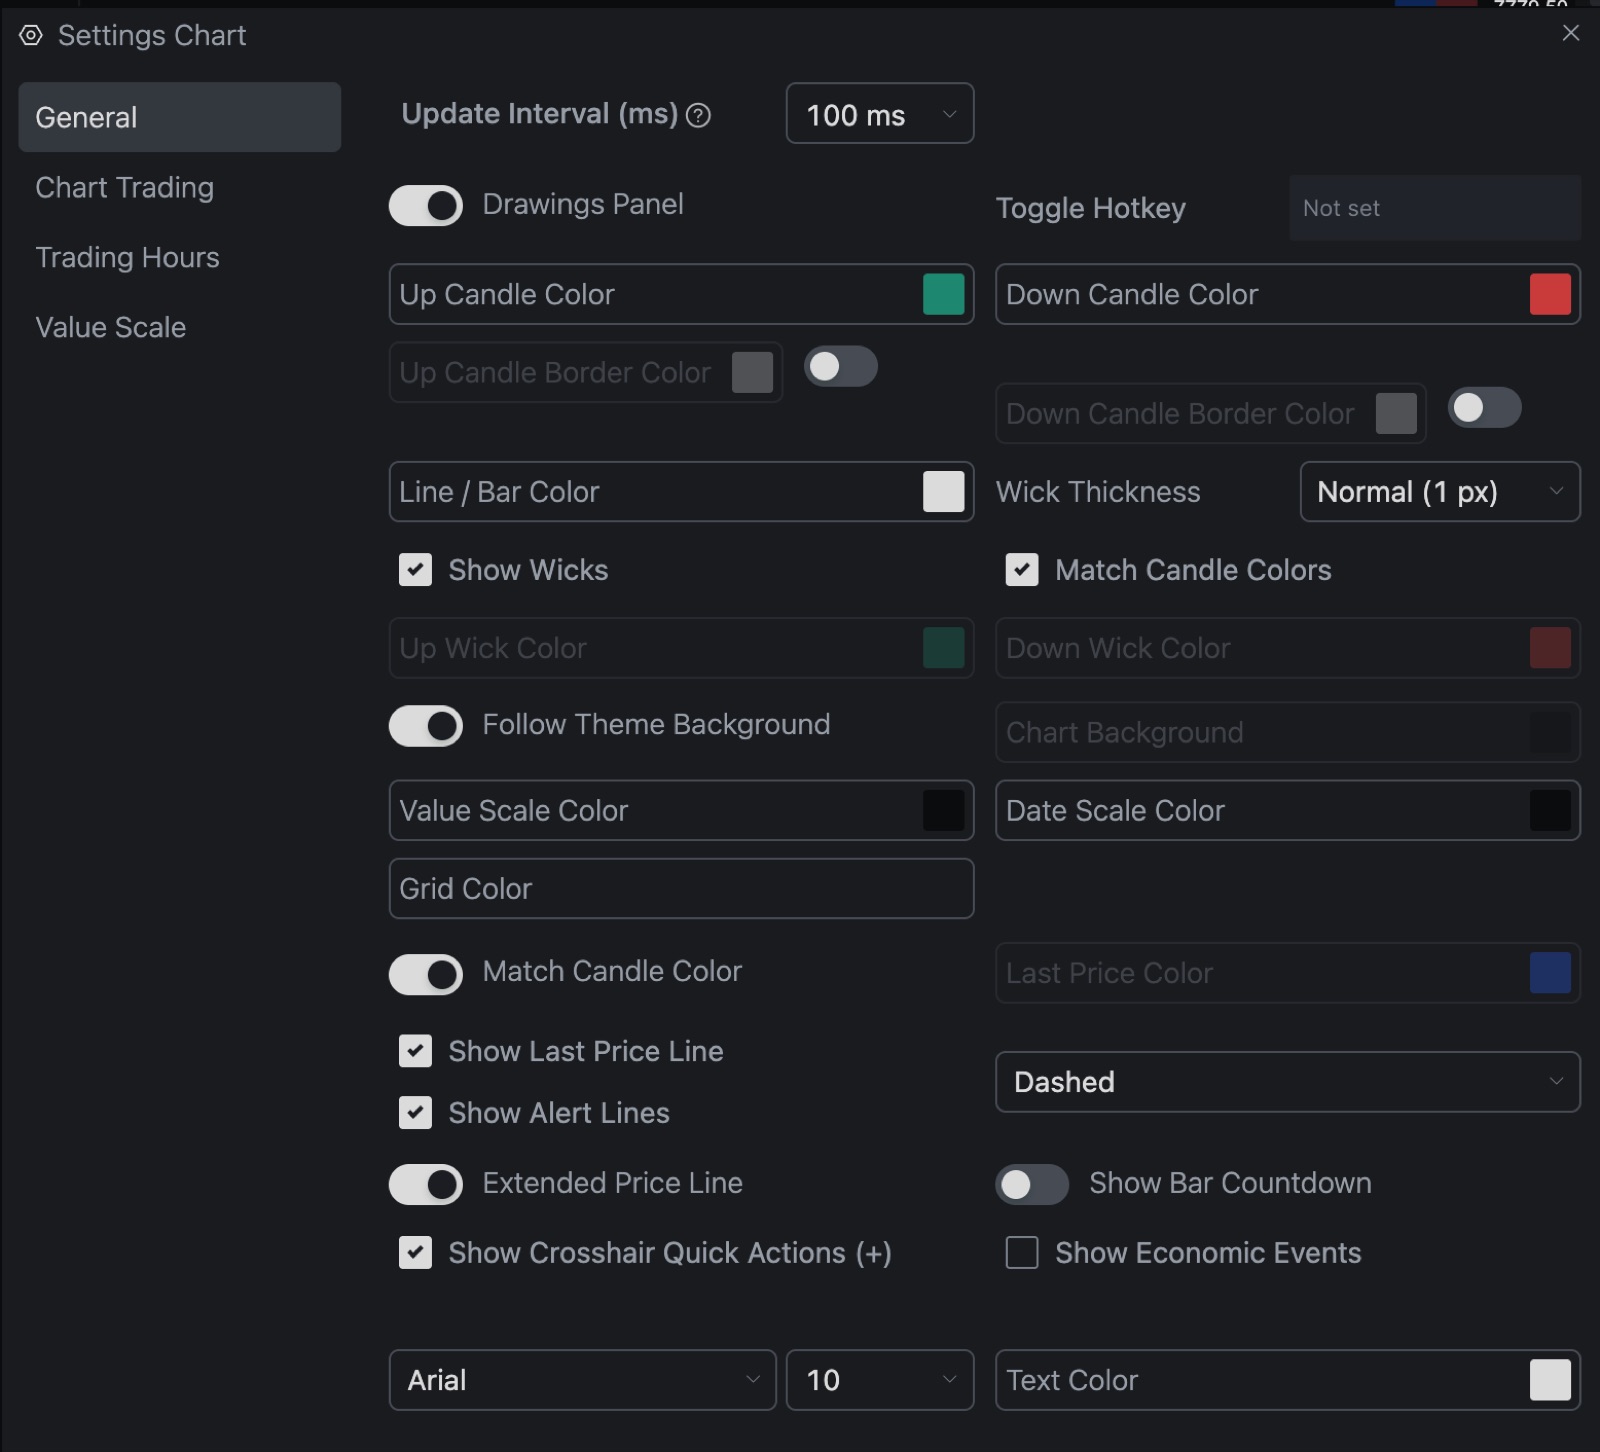
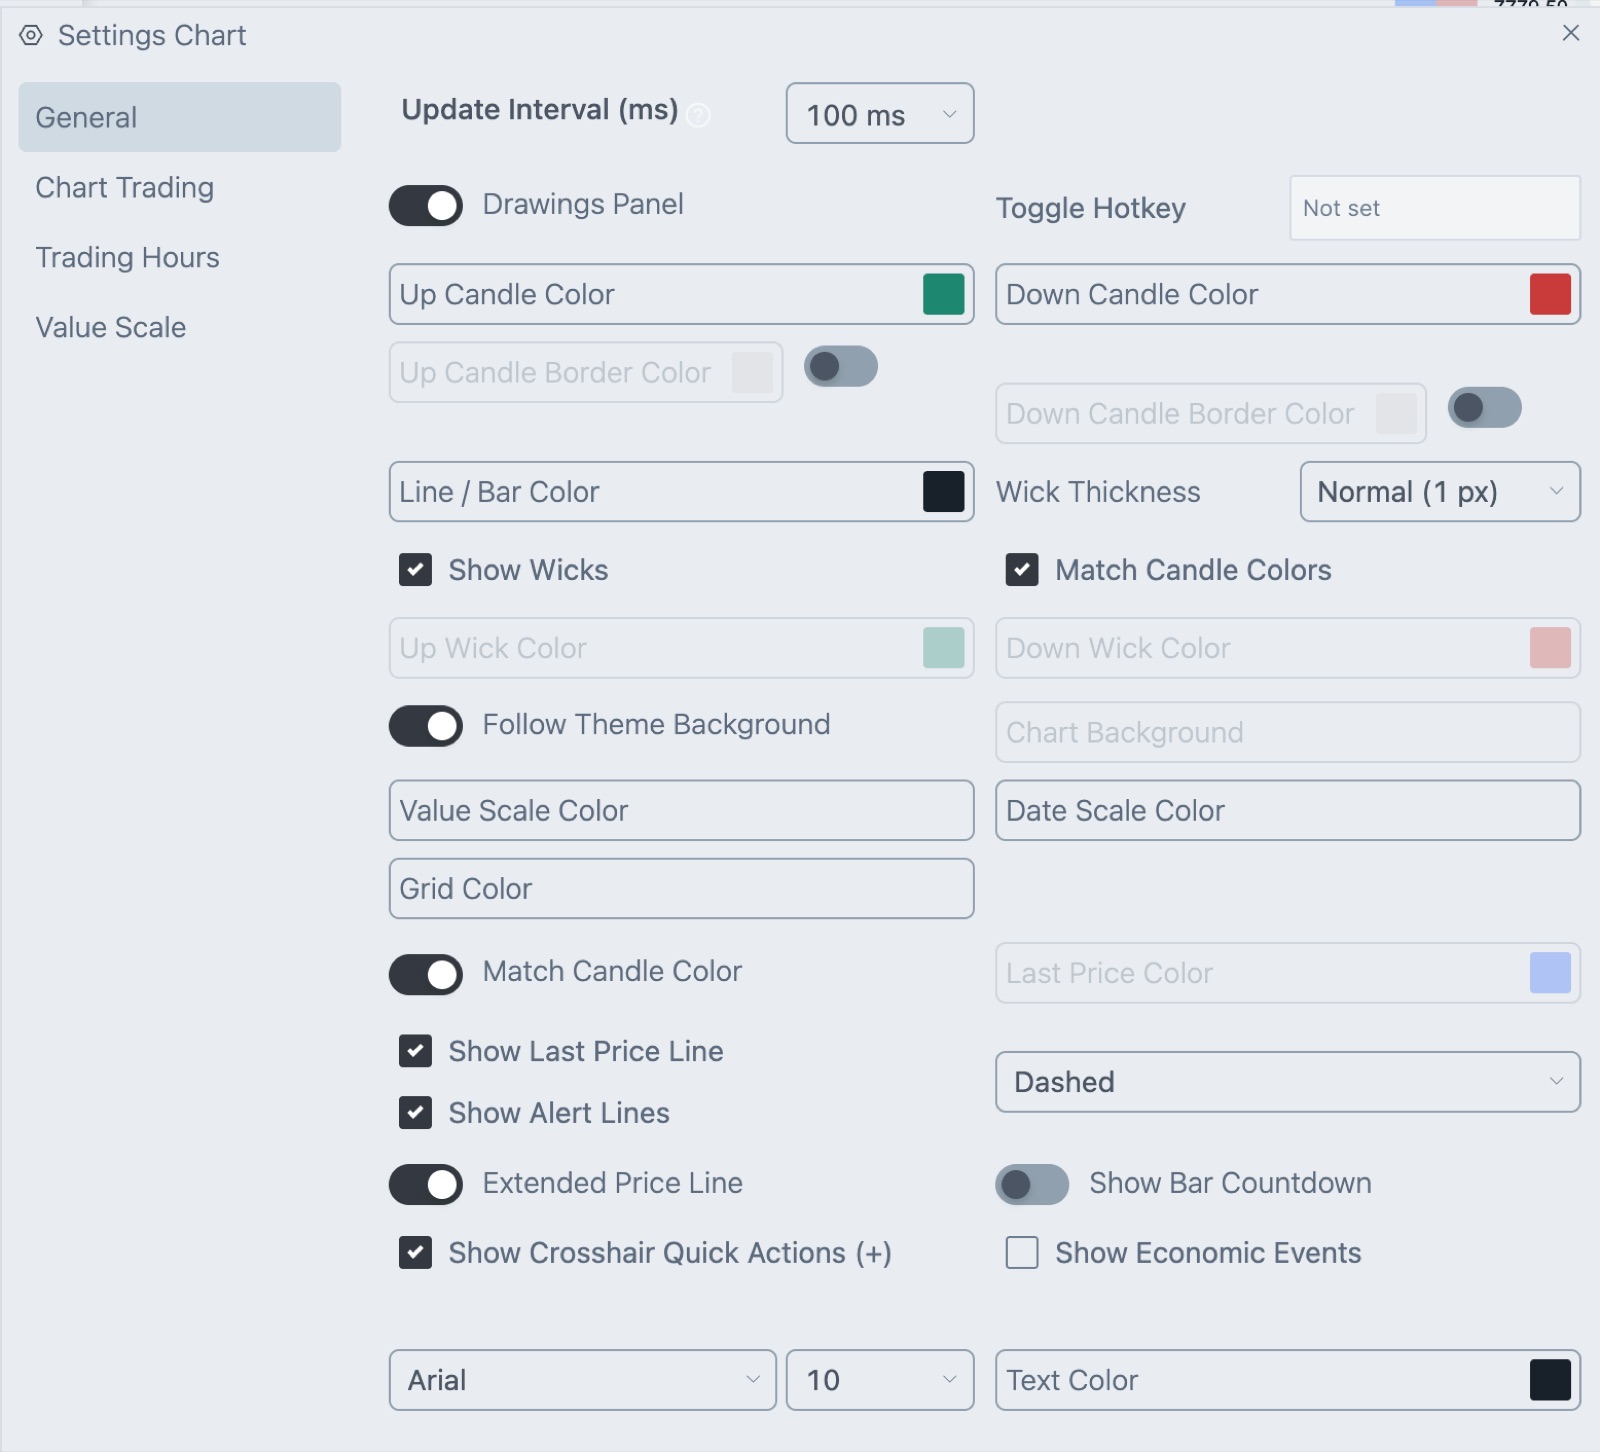
Changes show on the chart while the window is open. Press Esc to put the chart back to the settings it had when you opened the window. Closing the window keeps your changes.
General
| Setting | What it does |
|---|---|
| Update Interval (ms) | How often the chart redraws: 20, 50, 100 or 150 ms. Lower values update more often and can slow the app. 100 ms is the default and what we recommend. Some indicators use a slower minimum. |
| Drawings Panel | Shows or hides the drawing rail. On by default. |
| Toggle Hotkey | An optional key combination that shows or hides the drawing rail. |
| Up Candle Color, Down Candle Color | Fill colors for candles that close up and down. |
| Up Candle Border Color, Down Candle Border Color | Border colors. Turn on the switch beside each one to use it. |
| Line / Bar Color | The line of Line and Mountain, and the stroke of Bars. |
| Show Wicks | Draws candle wicks. On by default. |
| Wick Thickness | Normal (1 px) or Thin (0.5 px). |
| Match Candle Colors | Colors wicks like their candles. Turn it off to set Up Wick Color and Down Wick Color yourself. |
| Follow Theme Background | Uses the background of your Dark or Light theme. Turn it off to set Chart Background. |
| Value Scale Color, Date Scale Color, Grid Color | Colors of the price scale, the date scale and the grid lines. |
| Match Candle Color | Colors the last price line like the current candle. Turn it off to set Last Price Color. |
| Show Last Price Line | Draws a line at the last price. Choose Solid, Dashed or Dotted. Dashed is the default. |
| Extended Price Line | Extends the last price line across the chart. |
| Show Alert Lines | Draws your price alerts on the chart. See Price alerts. |
| Show Bar Countdown | Shows the time left in the current bar. Off by default. |
| Show Crosshair Quick Actions (+) | Shows the + button on the crosshair. On by default. See Crosshair quick actions. |
| Show Economic Events | Marks medium and high impact economic events on the chart. Click a marker for the previous and actual values. Off by default. |
| Font, size and Text Color | The text on the chart and its scales. Arial 10 is the default. |
Chart Trading
These settings apply when Trading on is switched on. See Trading from the chart.
Trading
| Setting | What it does |
|---|---|
| Show Working Orders | Draws your working orders on the chart. |
| Show Buy/Sell Columns | Shows the Buy and Sell columns next to the price scale. |
| Show P/L Info | Shows profit and loss information on the chart. |
| Show R/PL | Shows the realized P/L (R/PL) in the trade panel. |
| Show Instrument Change | Shows the price change in the chart header. Same as Show Changes in the right-click menu. |
| Show OHLV Info | Shows open, high, low and close in the chart header. Same as Show OHLV in the right-click menu. |
| Show ▲▼ on chart orders | Shows the buttons that move an order by one tick. |
| Snap orders to the same price | When you drag an order within 2 ticks of another order on the same side, it joins that price. Hold Alt (Option on a Mac) to skip snapping. |
| Order value | Shows order and position results in $, Points or Ticks. |
| Trade panel width | Narrow, Normal or Wide. |
| Position Color | Colors for Long and Short positions. |
| Order Entry Width | Width of the order entry area, in px or %. |
| Order and position alignment | Left, Center or Right. |
| Bracket Target Color, Bracket Stop Color | Colors of bracket target and stop lines. |
| Buy Column Color, Sell Column Color | Background colors of the two columns. |
Chart Markers
Markers show where your orders filled on the bars.
- Show marker at top/bottom of bar, Show marker at execution price and Show text with size and price choose what each marker shows.
- Data Box sets the Background color of the marker details box.
- Buy Marker and Font and Sell Marker and Font set the color, the shape (Triangle, Square or Dot) and the size (10 to 30).
Order Area
Choose which buttons the trade panel shows: Show Liquidate Button, Show Buy/Sell Market Buttons, Show Buy Bid / Sell Ask, Show Buy Ask / Sell Bid and Show Cancel All Button.
Time in force
Default time in force is DAY or GTC. Show DAY (Day Order) and Show GTC (Good-Till-Cancel) choose which buttons the trade panel offers. See Order types and time in force.
Trading Hours
Choose a session template to hide bars outside its hours. See Trading hours on the chart.
Value Scale
The price scale can fit the bars you see, or keep a fixed height for each price tick. You can also open these controls by right-clicking the price scale, or clicking the small gear at its corner. More settings… in that menu opens this section.
| Setting | What it does |
|---|---|
| Auto (fit to chart) | The scale fits the bars on screen. This is the default. |
| Use only price bars | With Auto selected, fits the visible price bars only. On by default for new charts. |
| Fixed spacing | Keeps every price tick the same height, so footprint rows keep their size. Set the height in px next to it (minimum 0.1, default 10). Higher values make footprint rows taller. |
| Top margin, Bottom margin | Empty space above and below the bars, from 0 to 40%. Default 10%. |
| Right margin | Empty space to the right of the latest bar, from 0 to 50%. Default 10%. |
With Auto, margins add space around the fitted data. With Fixed spacing, the chart shifts when the latest price enters a margin, and the tick height stays the same.
Tip. To reuse a chart's setup on new charts, right-click the chart and choose Save as default. See Right-click menu.
Related articles
Was this article helpful?