Chart window overview
The chart shows price bars for one instrument. The header toolbar sets the symbol, interval and chart type, adds indicators and drawings, and switches chart trading on.
Open a chart
- In the top bar, click + and choose Chart.
- Click the instrument name in the chart header and search for a symbol, for example
ES. - Click an interval in the header, for example 5m.
On a chart that uses Market Replay data, a REPLAY badge sits next to the instrument.
Window layout
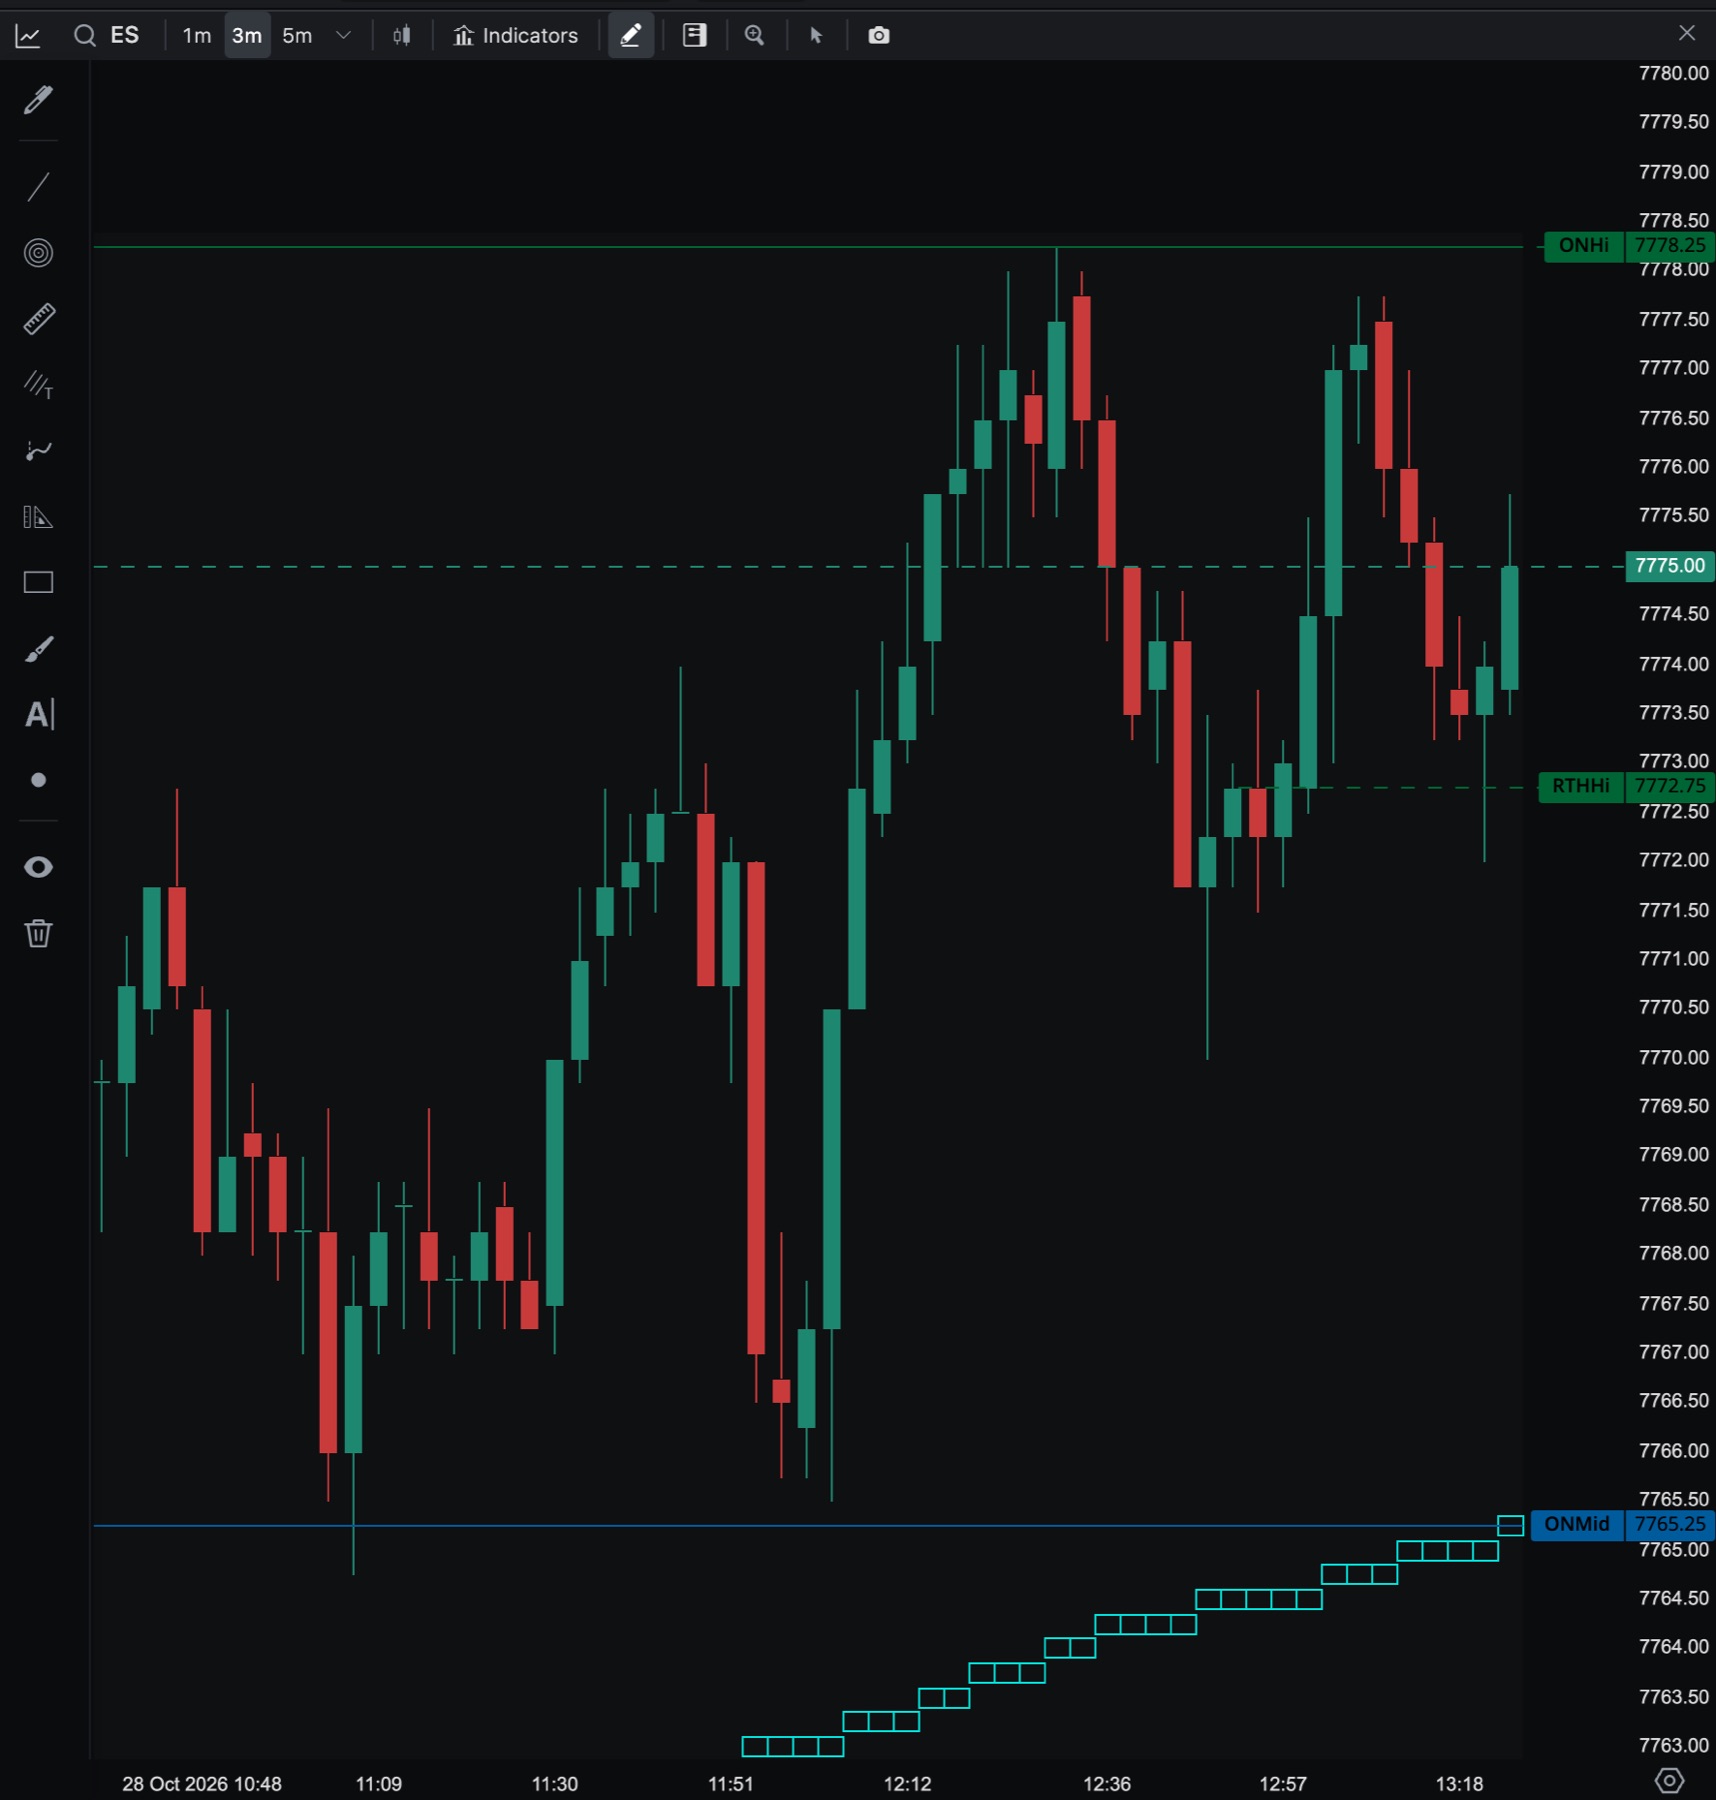
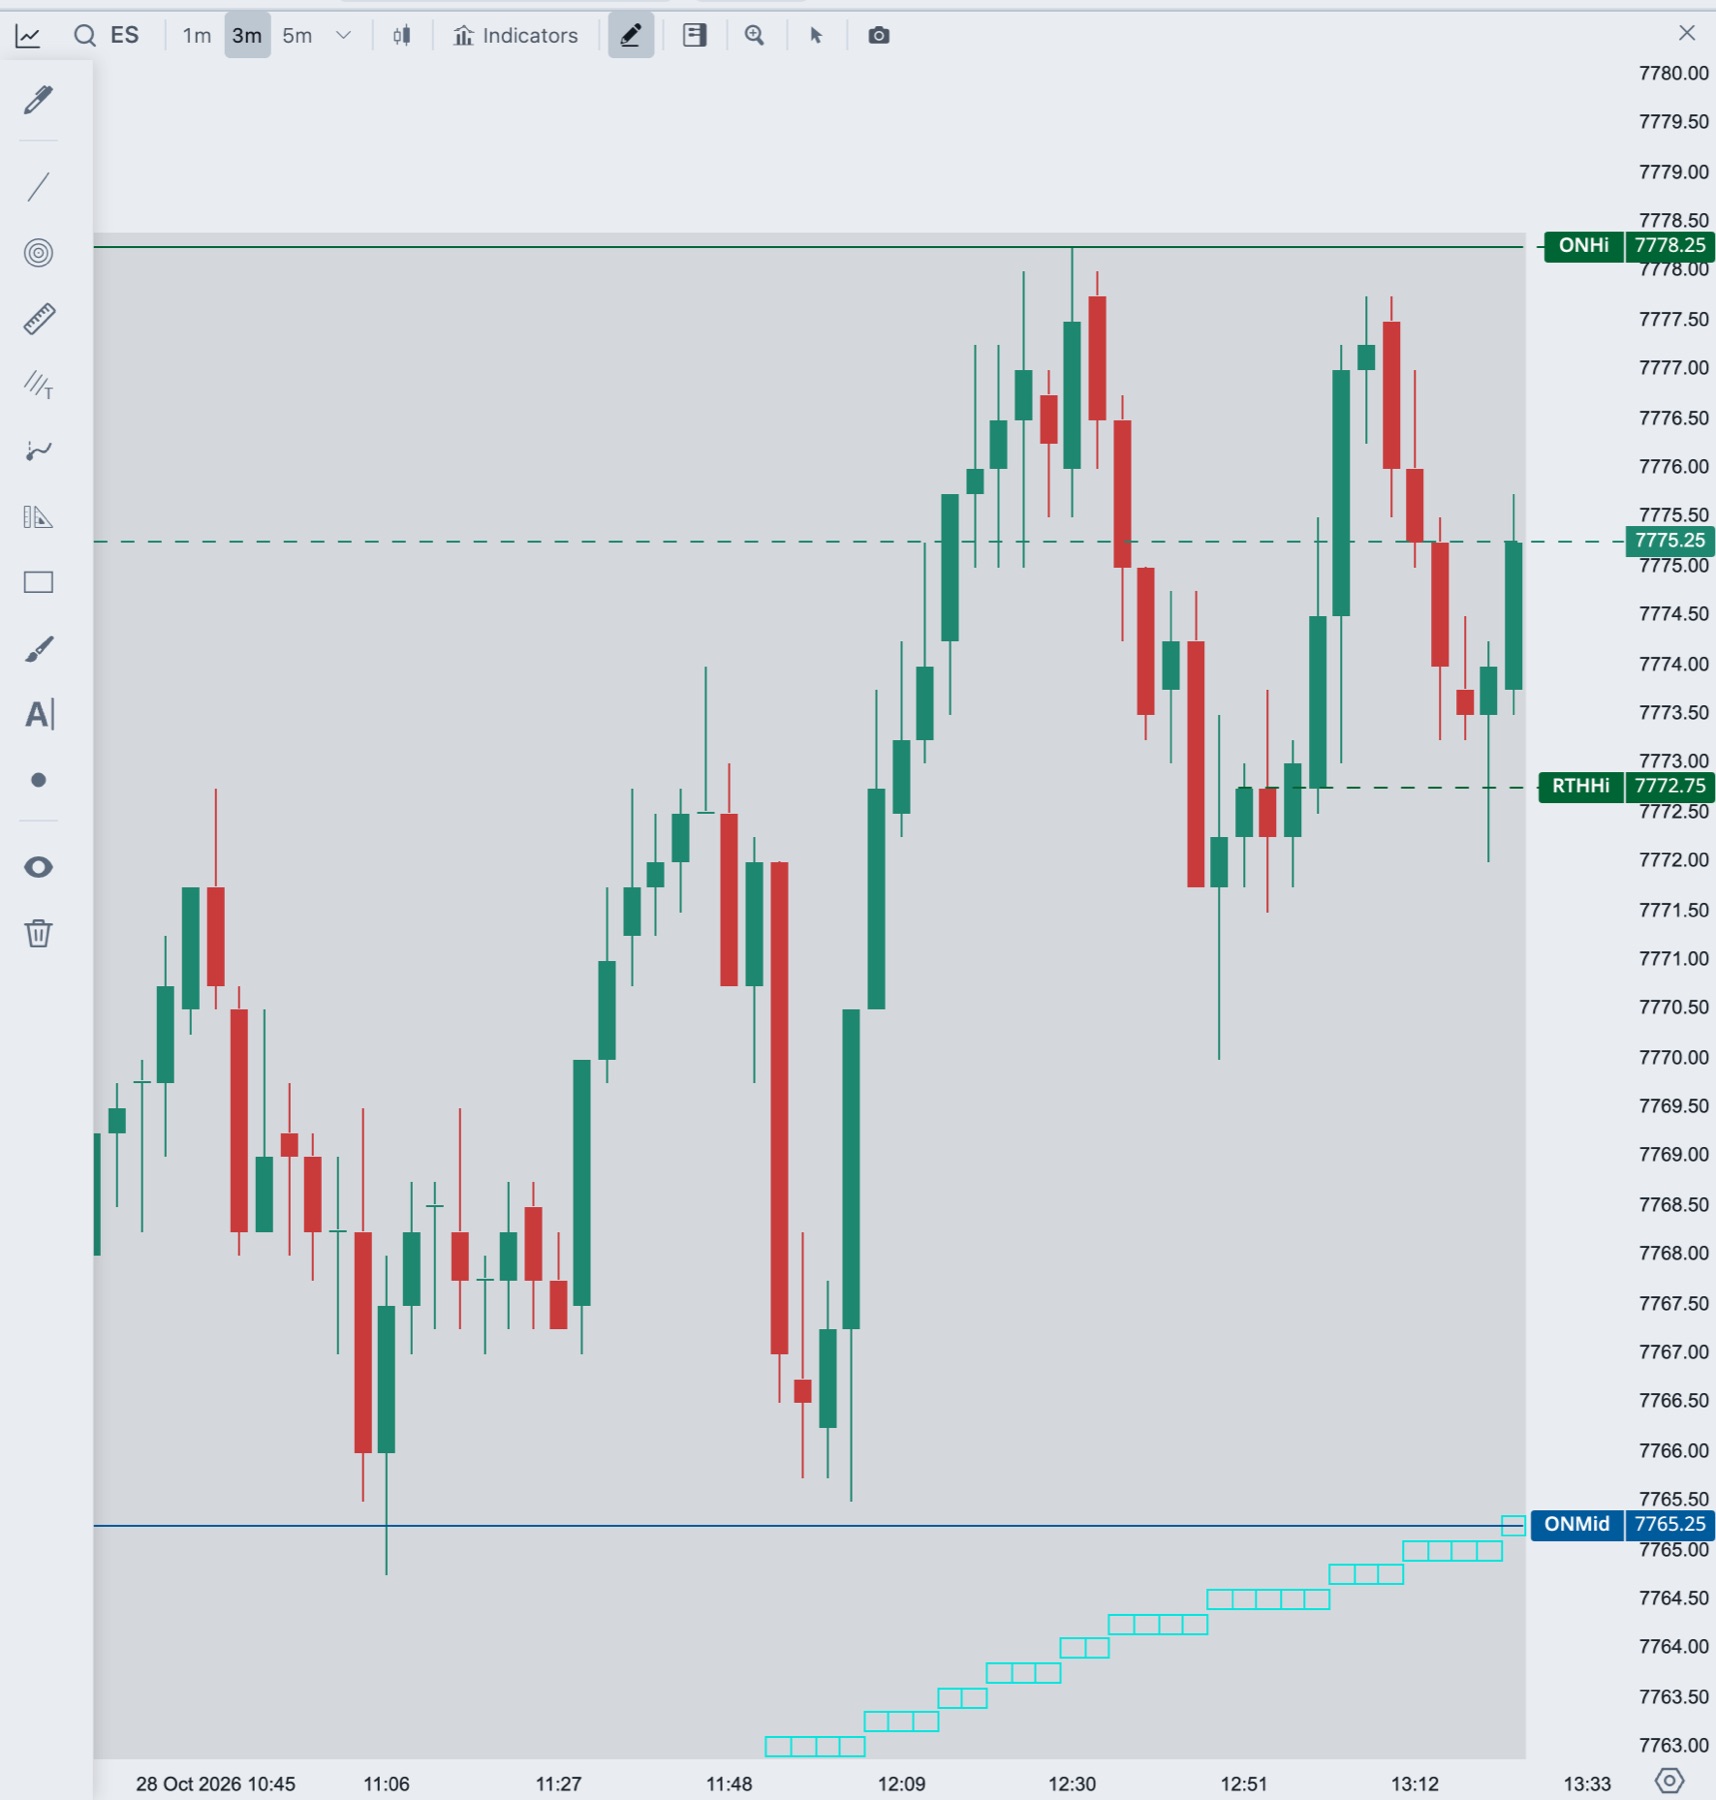
- Header toolbar
- 1Instrument
Click to search for and switch the symbol. - 2Intervals
Your favorite intervals. New charts start with 1m, 3m and 5m. - 3More intervals
Opens the full interval list and the history to load. - 4Bar Style
Switches the chart type, for example Candle or Heikin Ashi. - 5Indicators
Opens the Indicators dialog. - 6Drawings panel
Shows or hides the drawing tools on the left of the chart. - 7Trading on
Shows or hides the trade panel and the Buy and Sell columns. - 8Zoom
Zoom Date Range and Zoom Rect. - 9Cursor type
Arrow, Dot, Arrow with Markers or Crosshairs. - 10Make snapshot
Saves the chart as a PNG image. - Chart area
- 11Price scale
Drag to move, Shift + drag to zoom, double-click to reset. - 12Date scale
The time of each bar.
Header toolbar
Each button has a title tooltip. The buttons, from left to right:
- Interval buttons switch the interval with one click. The arrow next to them opens More intervals. See Timeframes and intervals.
- Bar Style chooses the chart type. See Chart types.
- Indicators opens the dialog where you add and manage indicators. See Add and manage indicators.
- Drawings panel toggles the tool rail. See Drawing tools.
- Trading on turns on chart trading. The trading buttons then show at the right end of the title bar. See Trading from the chart.
- Zoom, Cursor type and Make snapshot. See Cursor, zoom and snapshots.
Tip. In a narrow chart window the toolbar shrinks. Only the active interval stays visible, and the other tools move into the More chart tools menu (the three dots). The menu holds Bar style, Indicators, Drawings panel, Trading Controls, Zoom, Cursor and Make snapshot.
Price scale and date scale
- Drag the price scale to move the chart up or down. Hold Shift and drag to zoom the price. Double-click to reset. Hover the scale for two seconds and Tradrr shows this hint.
- Right-click the price scale, or click the small gear at its bottom corner, to open the Price scale settings menu. See Chart settings.
- The date scale shows the time of each bar.
Navigation buttons
Move the pointer to the bottom of the chart to show the navigation buttons:
| Button | What it does |
|---|---|
| Scroll to first | Jumps to the oldest bar that is loaded. |
| Scroll left, Scroll right | Moves the chart back or forward in time. |
| Scroll to last | Jumps to the newest bar. |
| Zoom out, Zoom in | Shows more or fewer bars. |
| Reload | Reloads the chart data. |
When you scroll away from the latest bar, a Return to live button appears near the bottom right of the chart. Click it to jump back to the live edge.
Hold to read a bar
Press and hold the left mouse button on an empty part of the chart for a moment without moving. A small box shows Open, High, Low, Close and Vol for the bar under the crosshair. Release the button to close it.
Right-click menu
Right-click an empty part of the chart to open the chart menu.
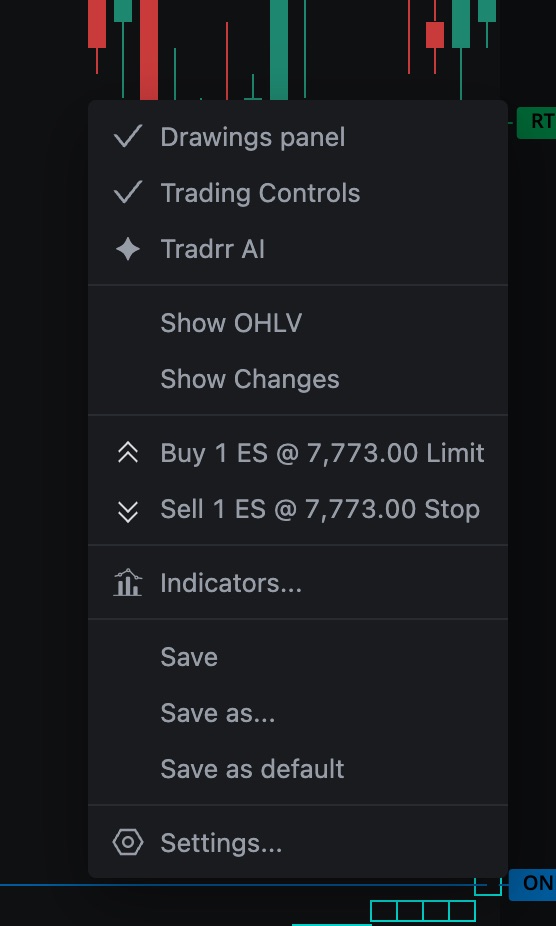
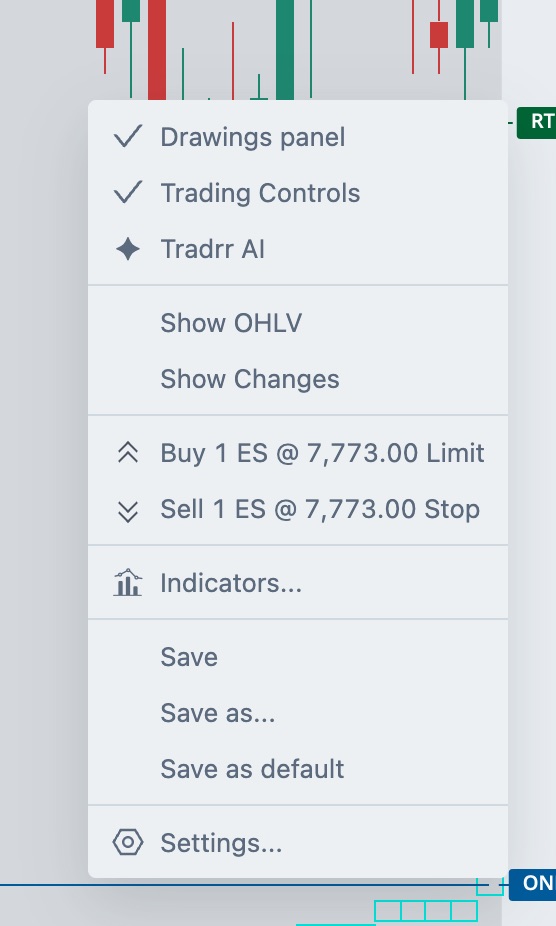
| Item | What it does |
|---|---|
| Drawings panel | Shows or hides the drawing tools. |
| Trading Controls | Turns chart trading on or off, the same as Trading on. |
| Tradrr AI | Shows or hides the chart analysis from Tradrr AI. Hiding it clears the AI drawings from the chart. It uses your Tradrr AI subscription. |
| Show OHLV | Shows or hides the open, high, low and close readout in the chart header. |
| Show Changes | Shows or hides the price change readout. |
| Create alert @ price | Opens a price alert at the price under the pointer. It shows on Rithmic charts, so you won't see it on every chart. See Price alerts. |
| Buy and Sell at price | Two quick orders at the price you right-clicked, with the quantity from the trade panel. The labels read like Buy 1 ES @ 7,773.00 Limit and Sell 1 ES @ 7,773.00 Stop. They appear when Trading is on. See Crosshair quick actions. |
| Indicators... | Opens the Indicators dialog. |
| Save, Save as..., Save as default | Saves this chart's setup as a chart template. Save is available once a template is loaded. |
| Settings... | Opens Chart settings. |
Practice first
Open a chart on Market Replay and turn on chart trading with the practice account. No real money is at risk.
Related articles
Was this article helpful?