Add and manage indicators
The Indicators window adds, removes, hides, reorders and configures the indicators on one chart. It has a catalogue on one side and the list of indicators already on the chart on the other.
Open the Indicators window
- In the chart header, click Indicators.
- The window opens with the top indicator of the On Chart list selected, so its settings are ready to edit.
Only one Indicators window is open at a time. If you click Indicators again for the same chart, the open window comes to the front.

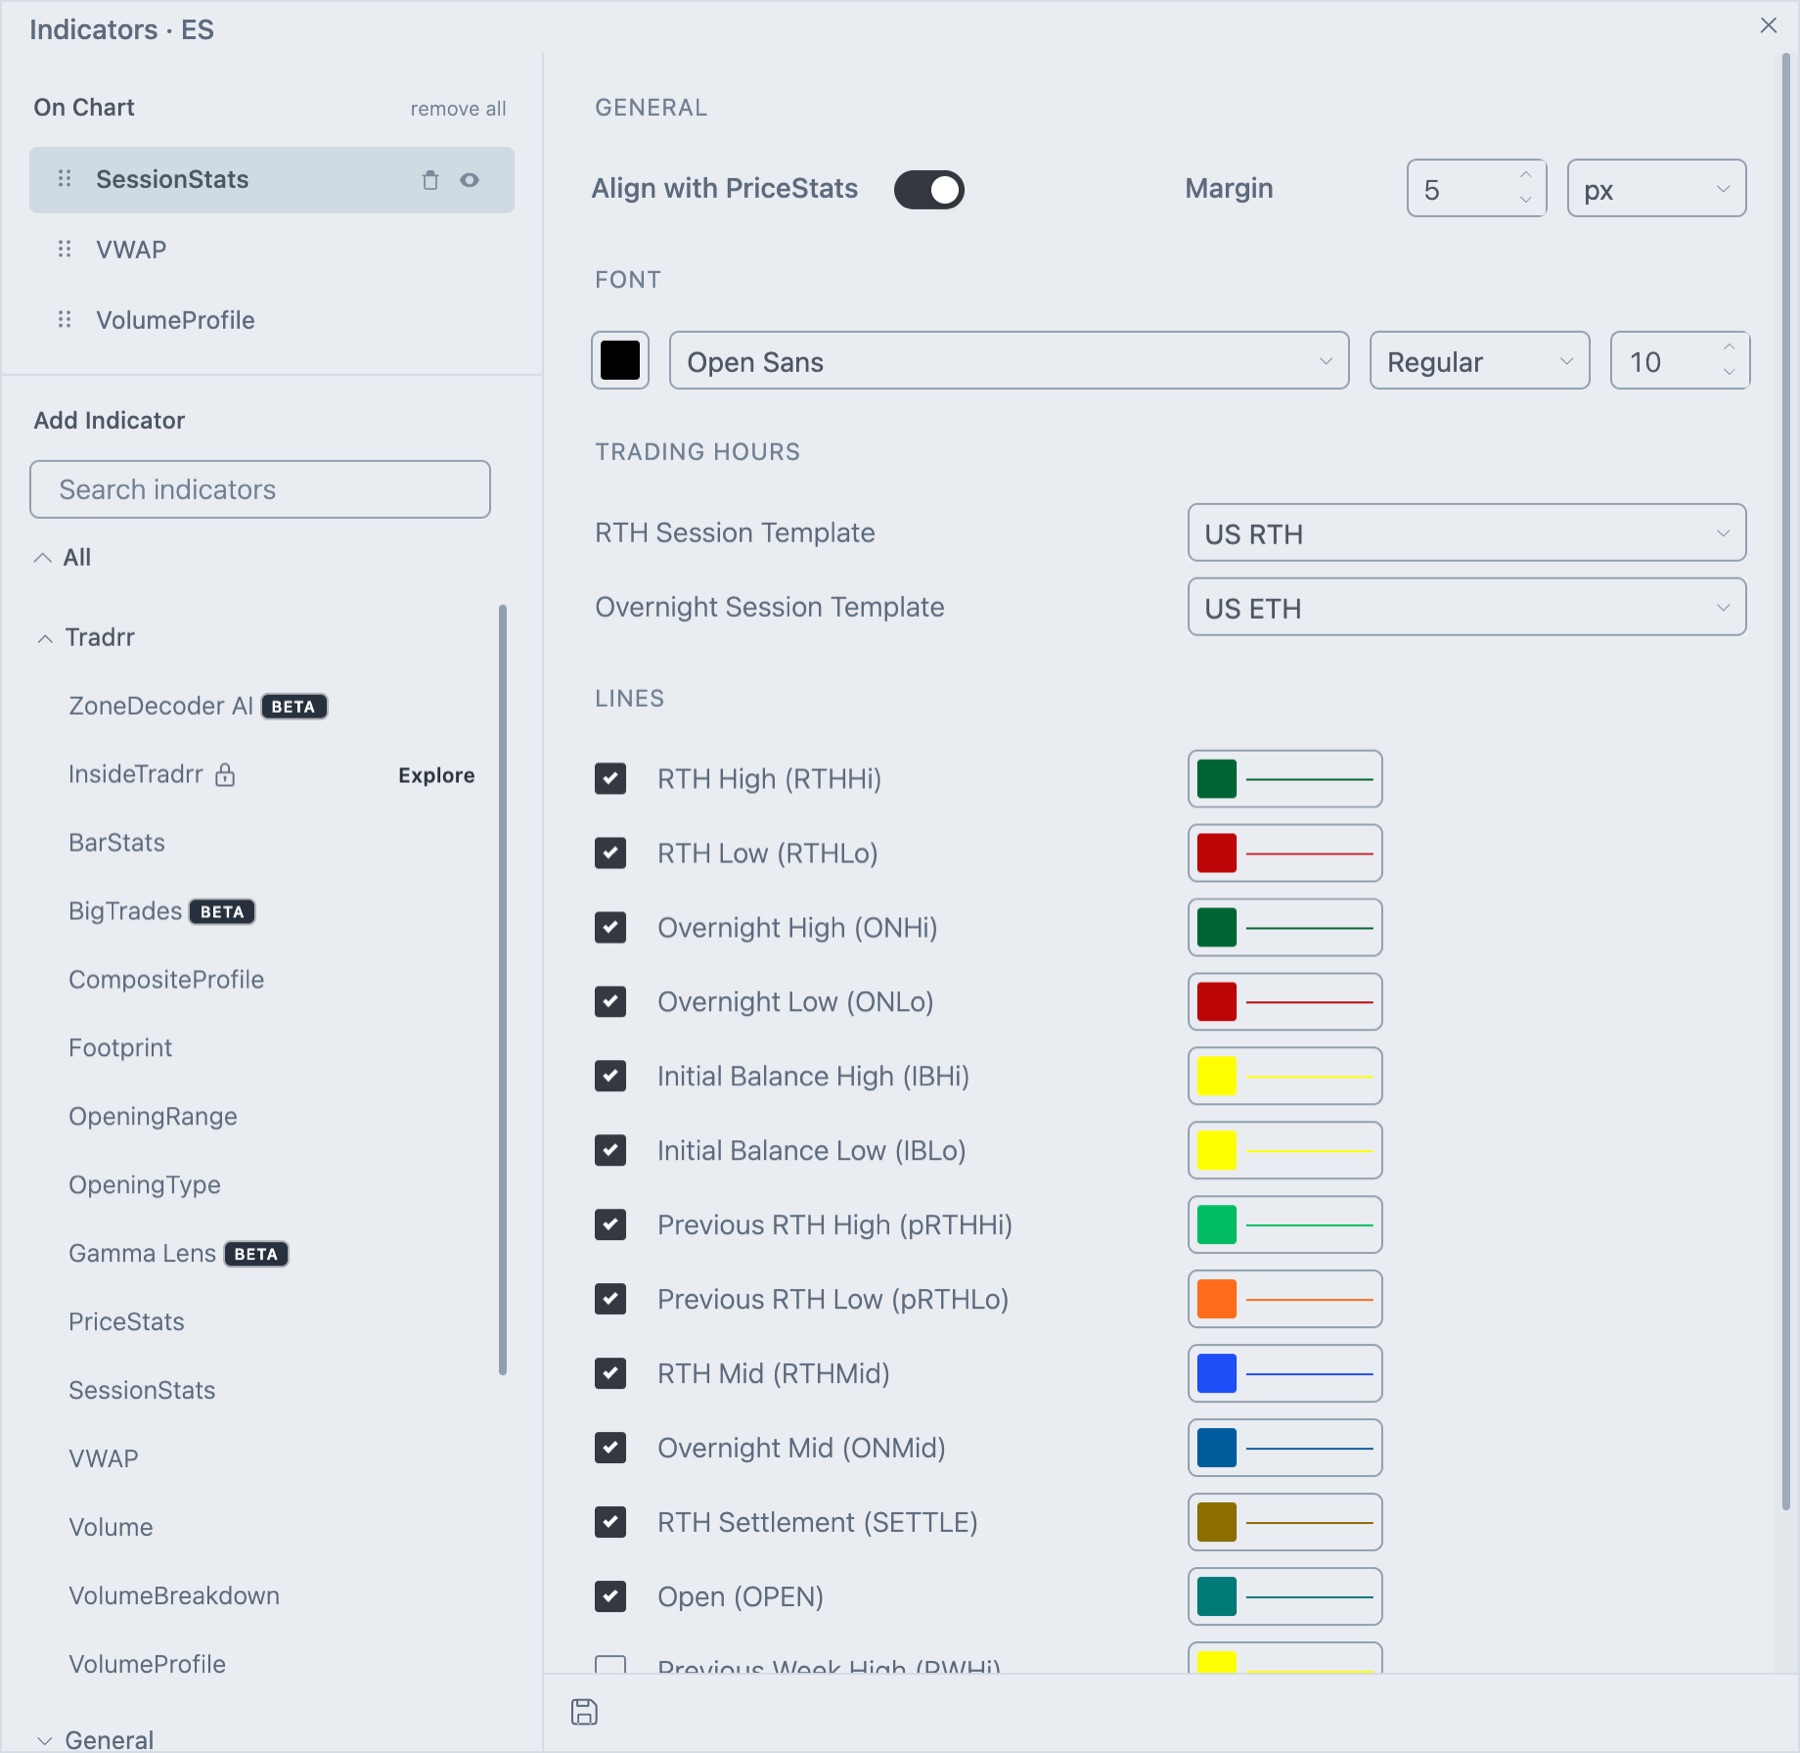
- 1Search
Type part of a name to filter the catalogue. - 2Catalogue
Indicators grouped by category. Click one to add it. - 3On Chart
The indicators on this chart. Click one to edit its settings.
Add an indicator
- Under Add Indicator, find the indicator. Open a category, or type in Search indicators.
- Click the indicator. It is added to the chart and its settings open on the right.
- Change the settings. The chart updates as you edit them.
The catalogue groups indicators as Tradrr, General, Bands, Index, Moving Average, Oscillator, Regression and Others. The arrow next to All opens or closes every group at once. While you search, results from all groups appear in one list with their category on each row. If nothing matches, the list reads No indicators found.
The catalogue can also show InsideTradrr with a lock and Explore beside it. It is a link to a separate product, not an indicator you can add to the chart.
Several names in the catalogue have no spaces, for example VolumeProfile, VolumeBreakdown, CompositeProfile, BarStats and BigTrades. Search for part of the name, such as profile.
Tradrr indicators
| Indicator | What it shows |
|---|---|
| ZoneDecoder AI | AI reaction zones with a confidence percentage. Paid add-on. Beta. |
| Footprint | Bid and ask volume at every price inside each bar. |
| VolumeProfile | Volume traded at each price, one profile per period. |
| CompositeProfile | One profile built from the loaded bars, docked at the chart edge. |
| VWAP | Volume-weighted average price for the day and for regular hours. |
| Volume | Volume per bar in its own panel. |
| VolumeBreakdown | Delta, buy volume or sell volume per bar in its own panel. |
| BarStats | A table of volume and delta figures for each bar. |
| BigTrades | Circles at prices where a bar traded large size. Beta. |
| SessionStats | Session level labels on the chart, such as ONHi, RTHHi and ONLo. |
| PriceStats | Profile columns for the current session, the previous session and recent days. |
| OpeningRange | High and low of the first minutes after the session opens, with optional targets. |
| OpeningType | How the regular session opened, with a likely path and levels. |
Manage the indicators on a chart
The On Chart list shows every indicator on the chart.
| Control | What it does |
|---|---|
| Click a name | Selects the indicator and shows its settings. |
| Eye icon | Hides or shows the indicator without removing it. |
| Bin icon | Removes the indicator from the chart. |
| remove all | Removes every indicator from the chart. |
| Drag handle | Drag a row up or down to reorder. The top row draws in front. |
Some indicators can be added more than once, such as VWAP. The second copy is named VWAP (2). Others allow only one copy per chart. If you try to add a second one, Tradrr shows Only one instance of ... indicator is allowed. One-copy indicators include Footprint, VolumeProfile, CompositeProfile, Volume, VolumeBreakdown, BarStats, BigTrades, SessionStats, PriceStats, OpeningRange and OpeningType.
Save your own default settings
New indicators start with Tradrr's default settings. You can replace them with your own.
- Select the indicator in On Chart and set it up the way you want.
- Click the save icon at the bottom of the settings and choose Save as Default Template.
The next time you add that indicator, it starts with the saved settings. To go back, choose Reset Default Template and confirm Reset. Tradrr restores the factory template, then removes the indicator from the chart and adds it back with the factory settings. The option is greyed out until you have saved a template.
Troubleshooting
| Problem | What to do |
|---|---|
| An indicator is greyed out in the catalogue. | Hover it to read the reason. Footprint, VolumeProfile, CompositeProfile, PriceStats and BigTrades read This indicator is not compatible with TICK periodicity on a tick chart. Switch the chart to a time or range interval. |
| The indicator is on the chart but nothing draws. | Check the eye icon in On Chart. Footprint also needs bars wide enough to draw. See Footprint. |
| I can't find an indicator by its normal name. | Search for part of the name. Entries such as VolumeProfile are written without spaces. |
| Indicators cover each other. | Drag the one you want in front to the top of On Chart. |
Related articles
Was this article helpful?