LiquidityMap
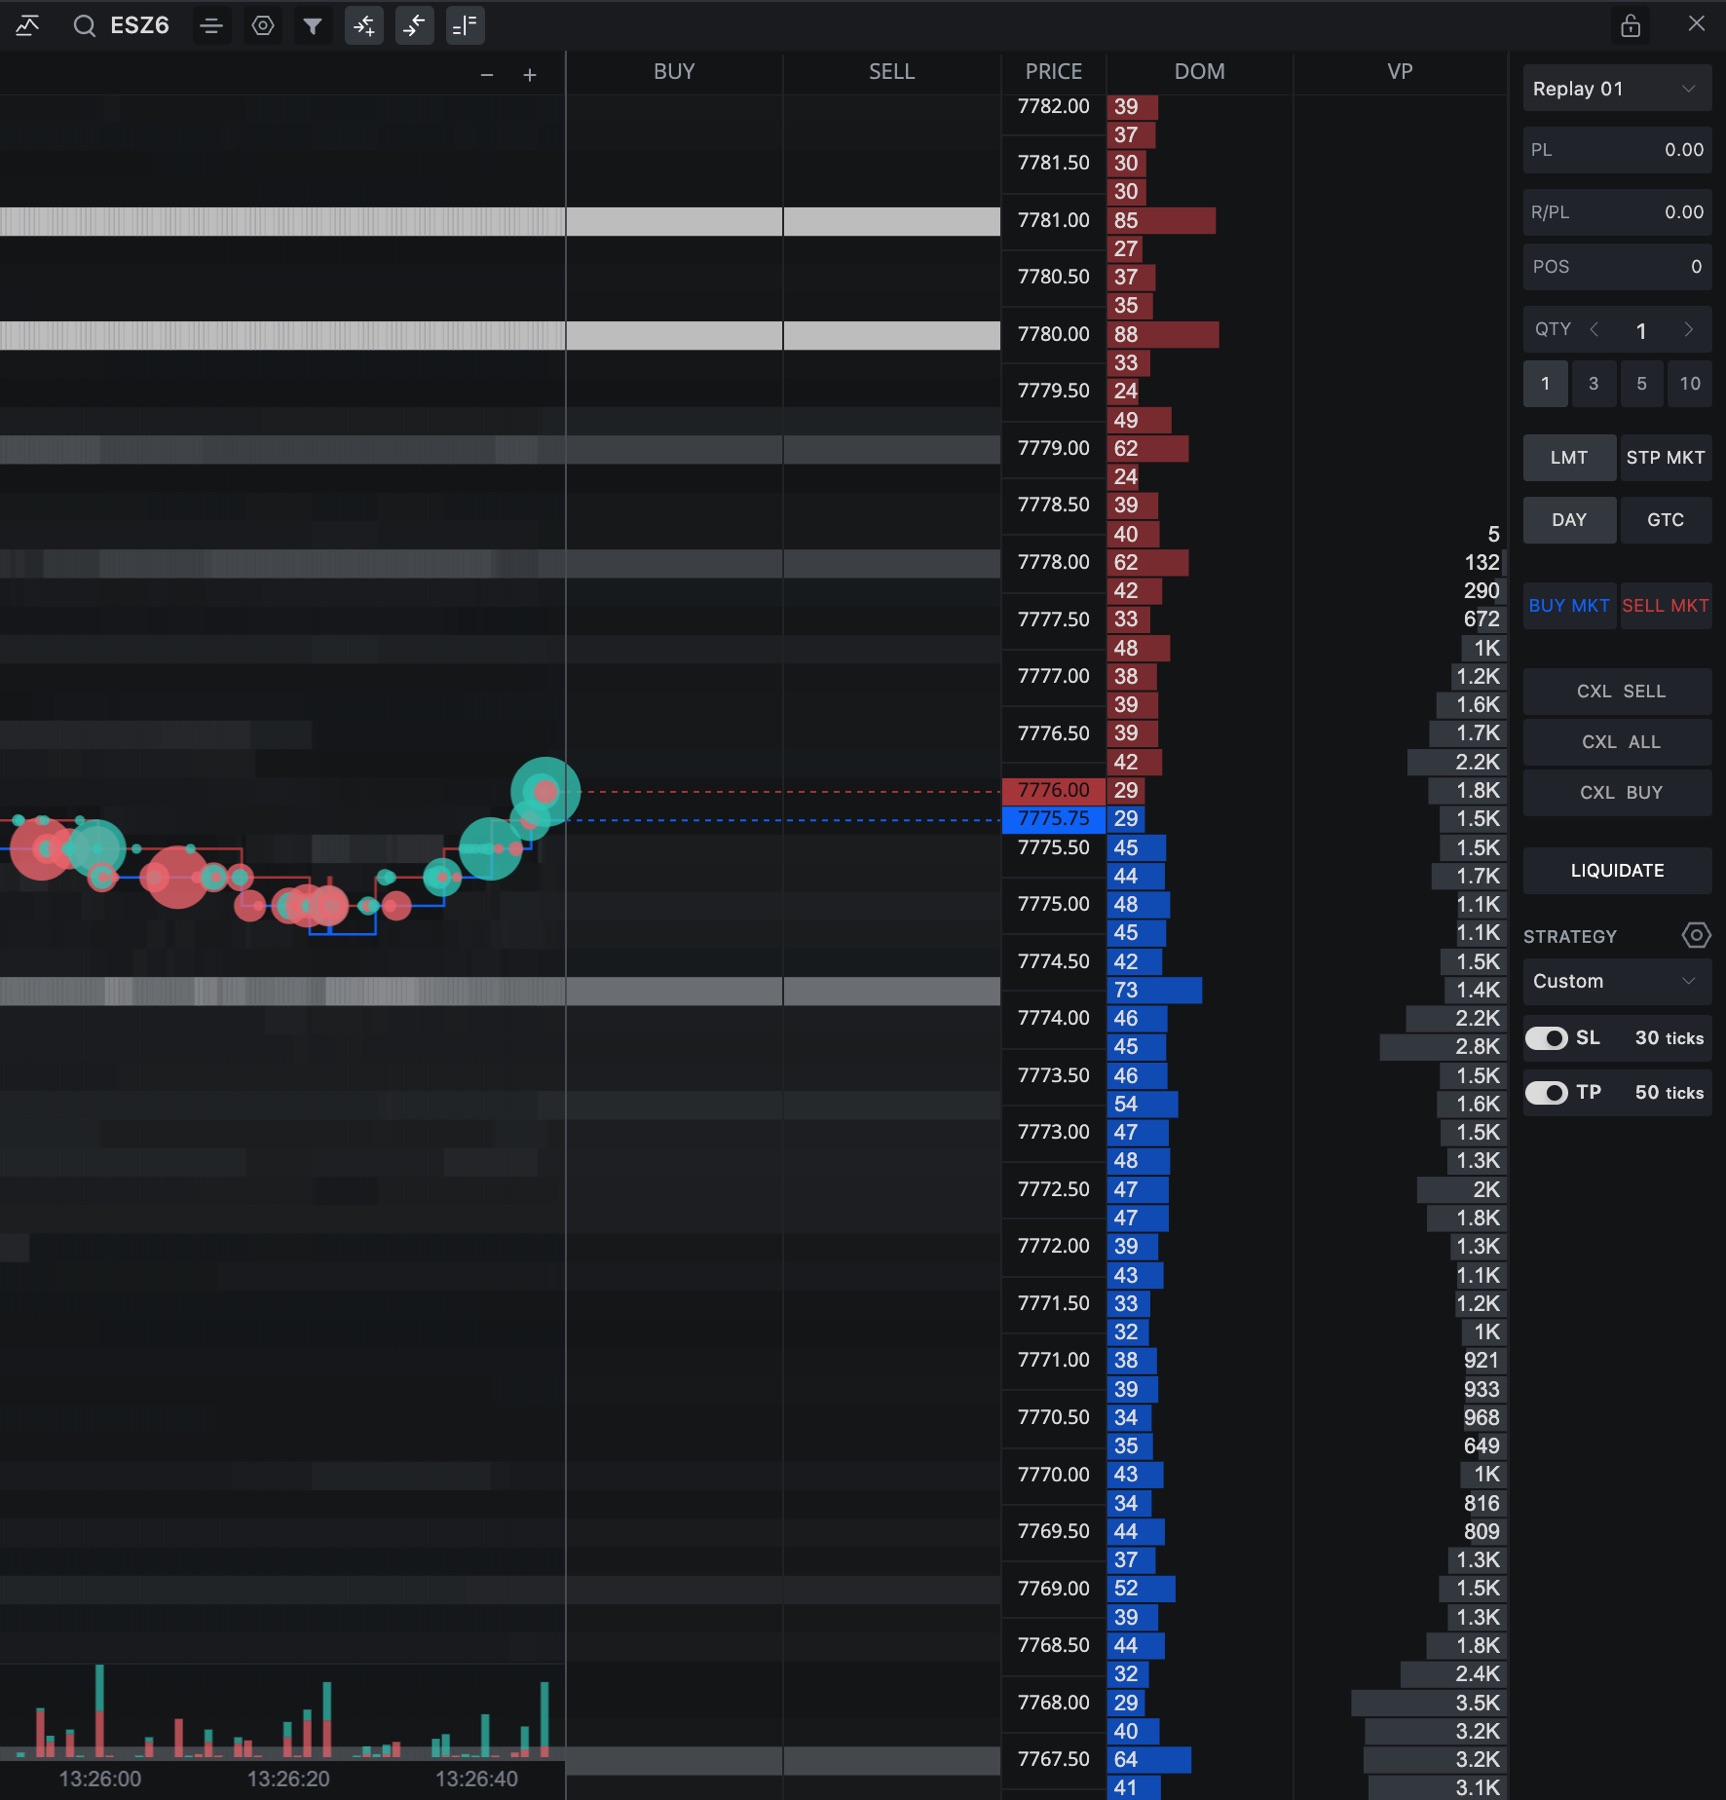
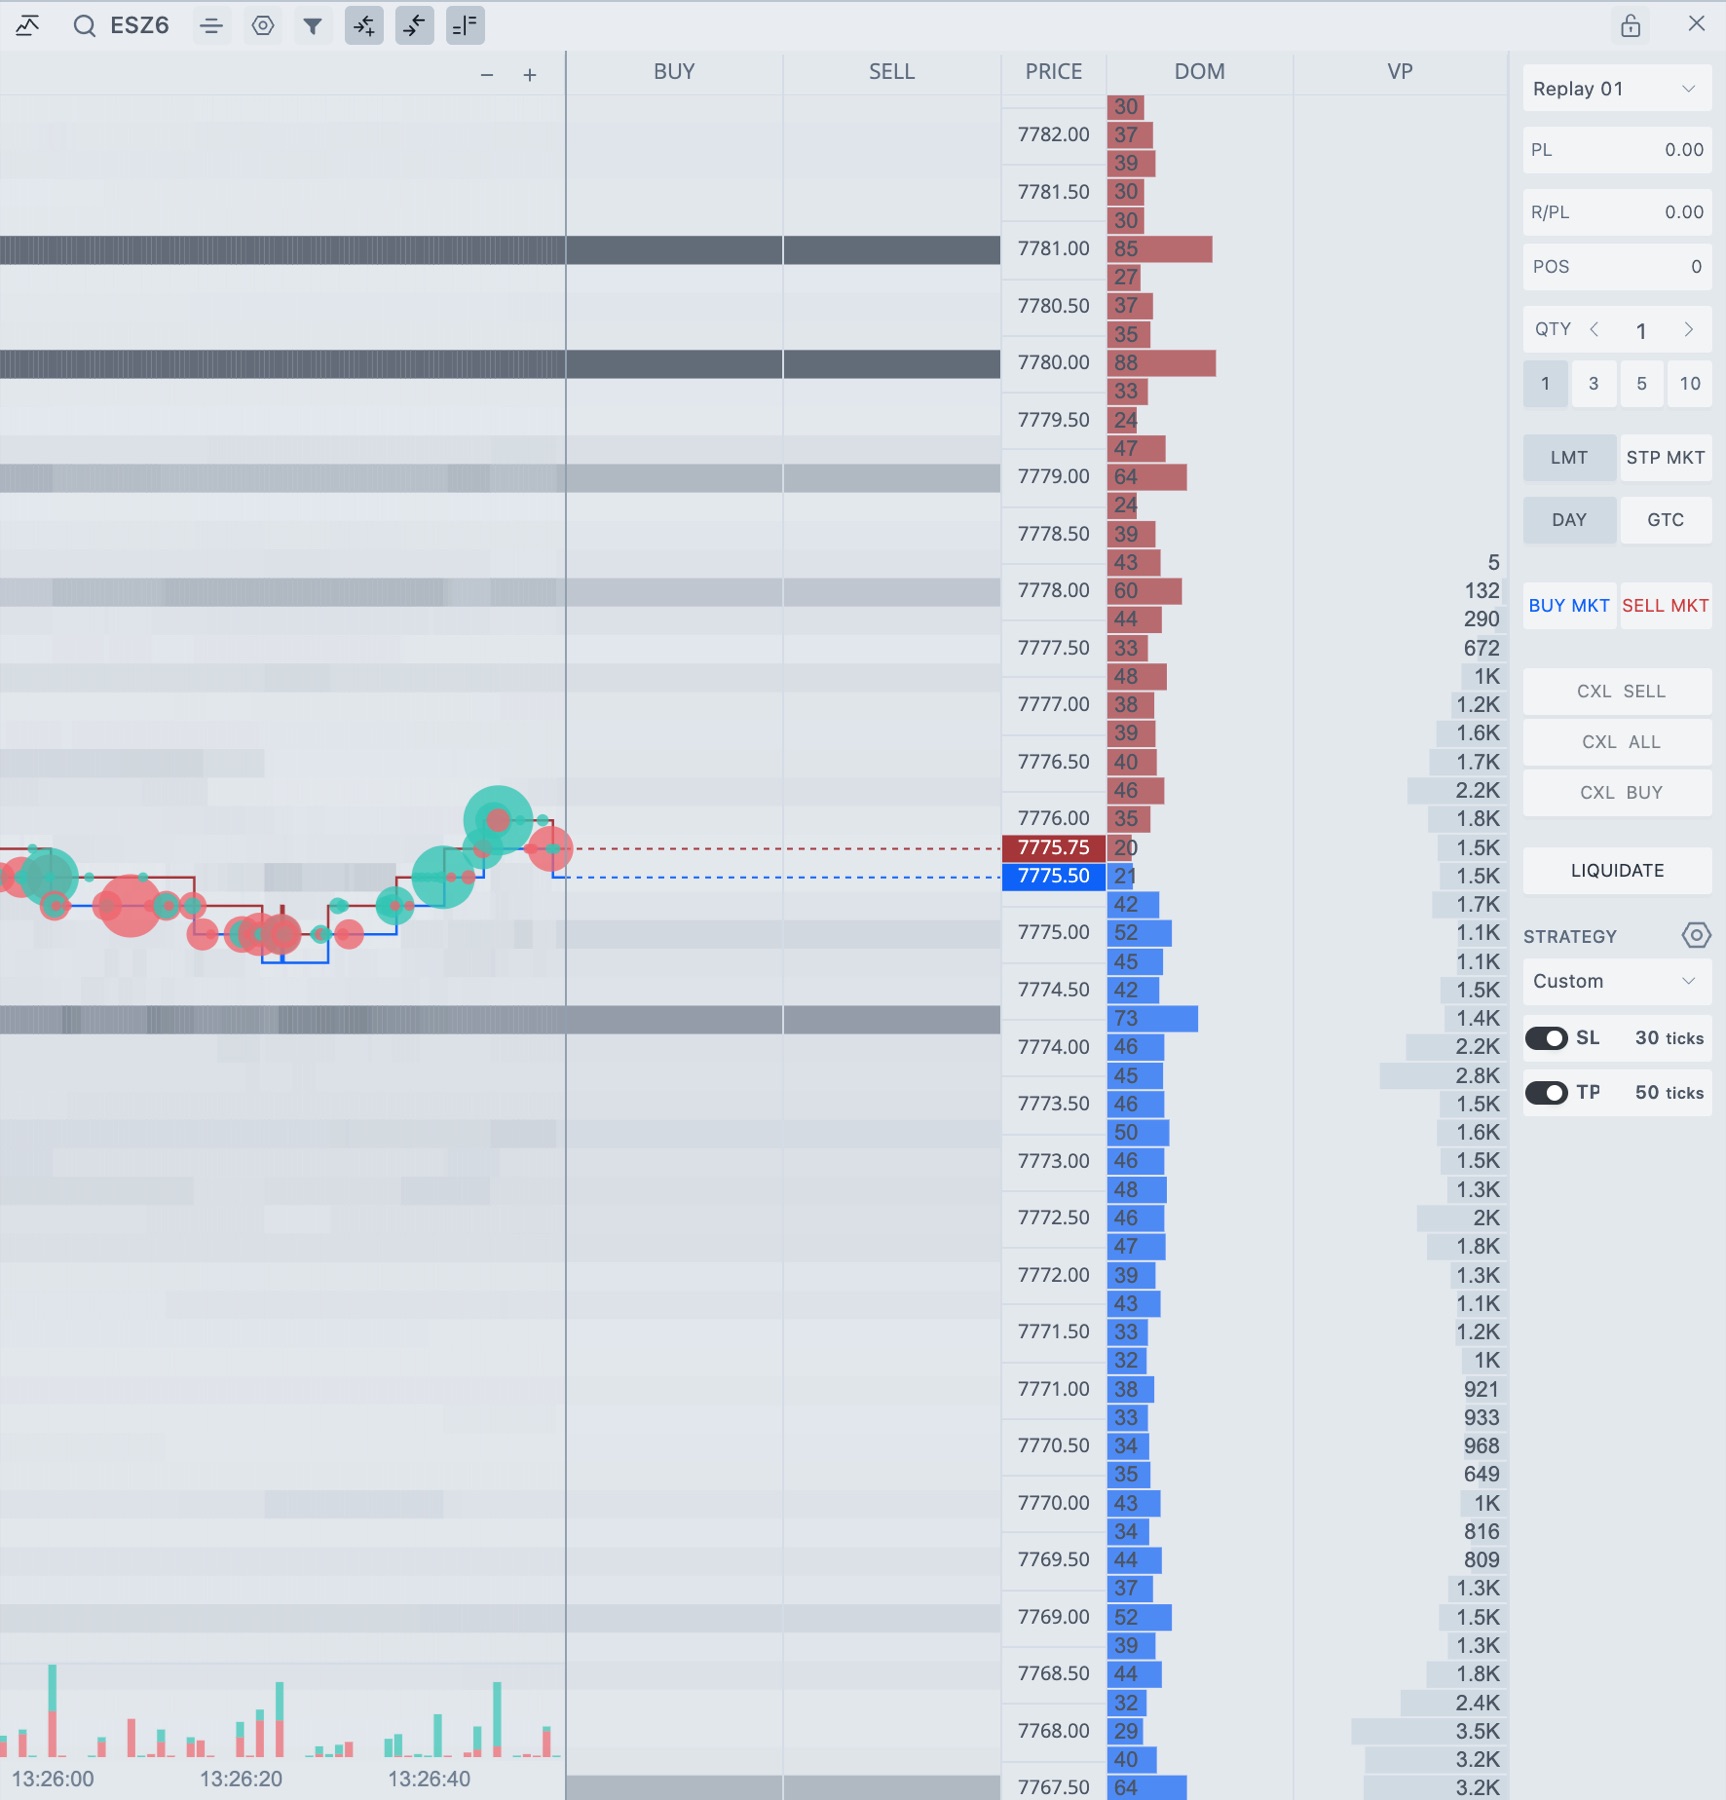
LiquidityMap plots the order book over time. Resting orders show as shading, the bid and ask run as lines, and trades show as bubbles sized by contracts. You can see where size is sitting and what price does when it gets there.
Beta. LiquidityMap is in beta. Settings and behavior can still change.
Open LiquidityMap
- In the top bar, click + and choose LiquidityMap.
- Click the instrument name in the title bar and search for a symbol, like
ES. - If you have more than one connection, pick the market data connection next to the symbol.
If the volume profile history can't load, the title bar says VP history unavailable.
What you're looking at
| Layer | What it shows |
|---|---|
| Liquidity | Shading for resting orders at each price over time. The stronger the color, the more contracts are sitting there. |
| Bid / Ask | The best bid and best ask as lines. |
| Trades | Bubbles for trades. Bigger bubble, bigger trade. Buys and sells have different colors. |
| Icebergs | Markers for iceberg candidates. These are orders that keep refilling after they trade. |
| DOM | A column next to the plot with the current depth. |
| VP | A session volume profile column. |
| Buy / Sell | Columns for placing orders at a price. See the trading section below. |
| Volume | A strip of executed volume under the plot. |
Move around
- Zoom time. Scroll over the plot, or click + and - in the plot header.
- Look back. Drag the plot to the right to see history. A button shows up to take you back to live.
- Back to live. Click Return to live, double-click the plot, press Esc, or right-click and choose Follow live market.
- Recenter price. Double-click the price scale, or click Center price in the title bar.
- Resize the right-hand columns. Drag the divider next to the plot.
Title bar
Everything in the title bar has a title tooltip. The trading buttons only show once chart trading is on.


- 1Instrument
Click to search for another symbol. - 2Center price
Puts the last price back in the middle. - 3Settings
Opens the LiquidityMap settings. See below. - 4Quick visual controls
Layers, colors and filters in one panel. See below. - 5Chart trading
Turns trading in this window on or off. - 6Hide trade panel
Hides or shows the trade panel. Chart trading stays on. - 7Buy/Sell column
Shows or hides the Buy and Sell columns you click to place orders. - 8Lock trading in this window
Stops orders from this LiquidityMap only. Click again to unlock it.
Turn off Header Panel in the right-click menu if you want a cleaner window. The instrument and the lock stay, the other buttons go. Turn it back on the same way.
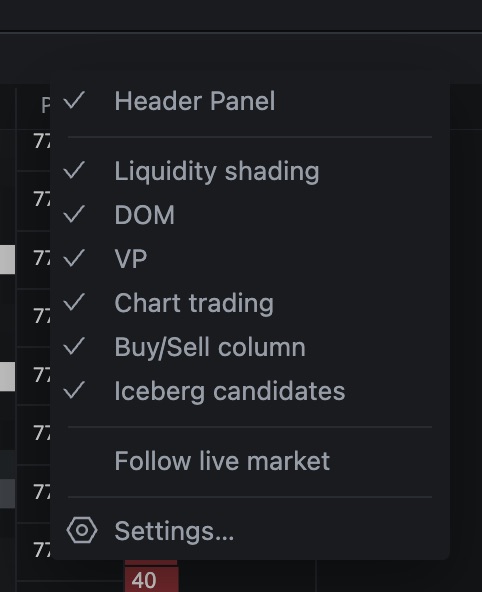
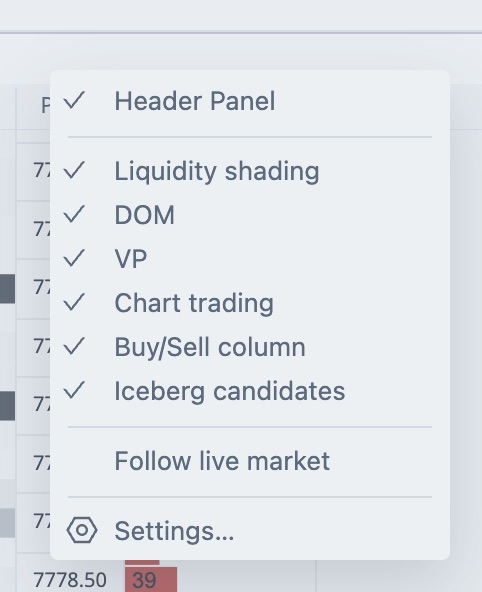
Right-click menu
Right-click the title bar or the plot. Both open the same menu.
| Menu item | What it does |
|---|---|
| Header Panel | Shows or hides the title bar buttons. |
| Buy and Sell at price | Two quick orders at the price you right-clicked, with the quantity from the trade panel. Below the market you get a buy limit and a sell stop, above it a sell limit and a buy stop. Only with chart trading on, and only when you right-click the plot. |
| Liquidity shading | The shading for resting orders. |
| DOM, VP | The depth column and the volume profile column. |
| Chart trading | Same as the Chart trading button. |
| Buy/Sell column | Same as the Buy/Sell column button. |
| Iceberg candidates | The iceberg markers. |
| Follow live market | Jumps back to live after you scrolled into history. |
| Settings... | Opens the LiquidityMap settings. |
Quick visual controls
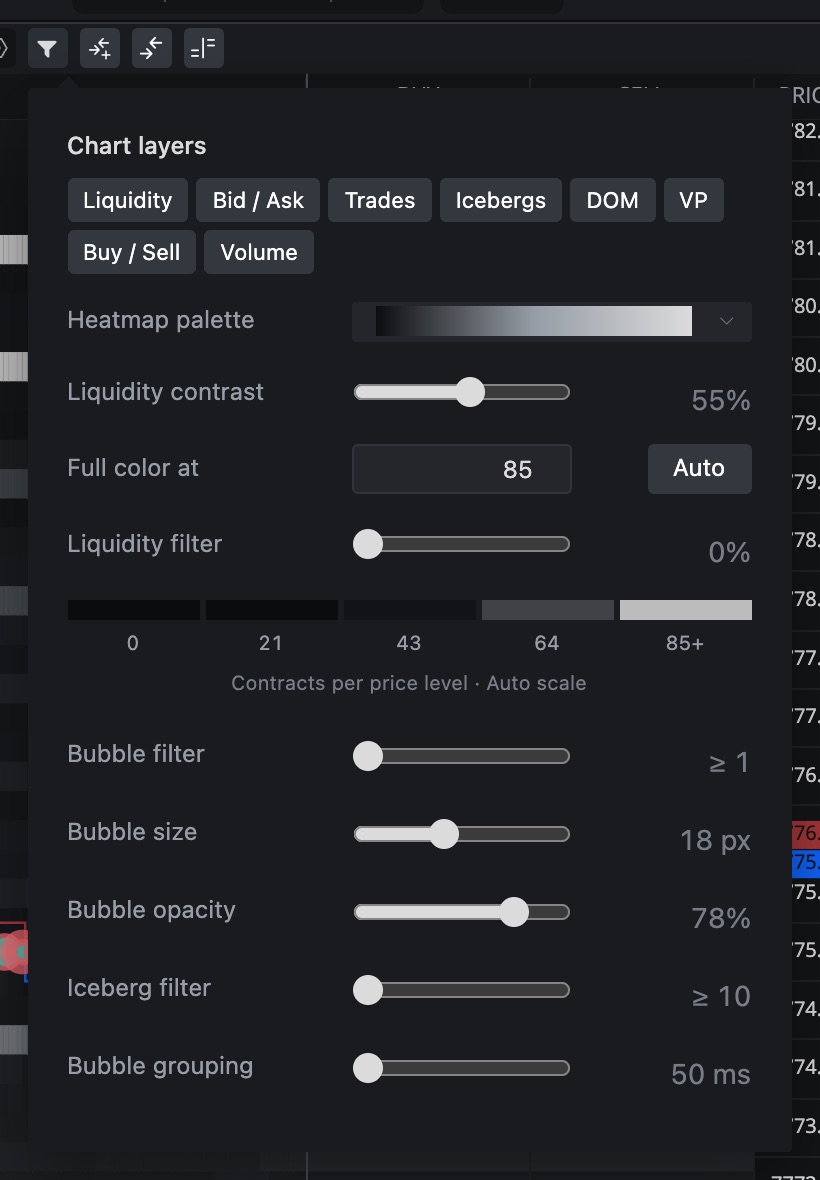
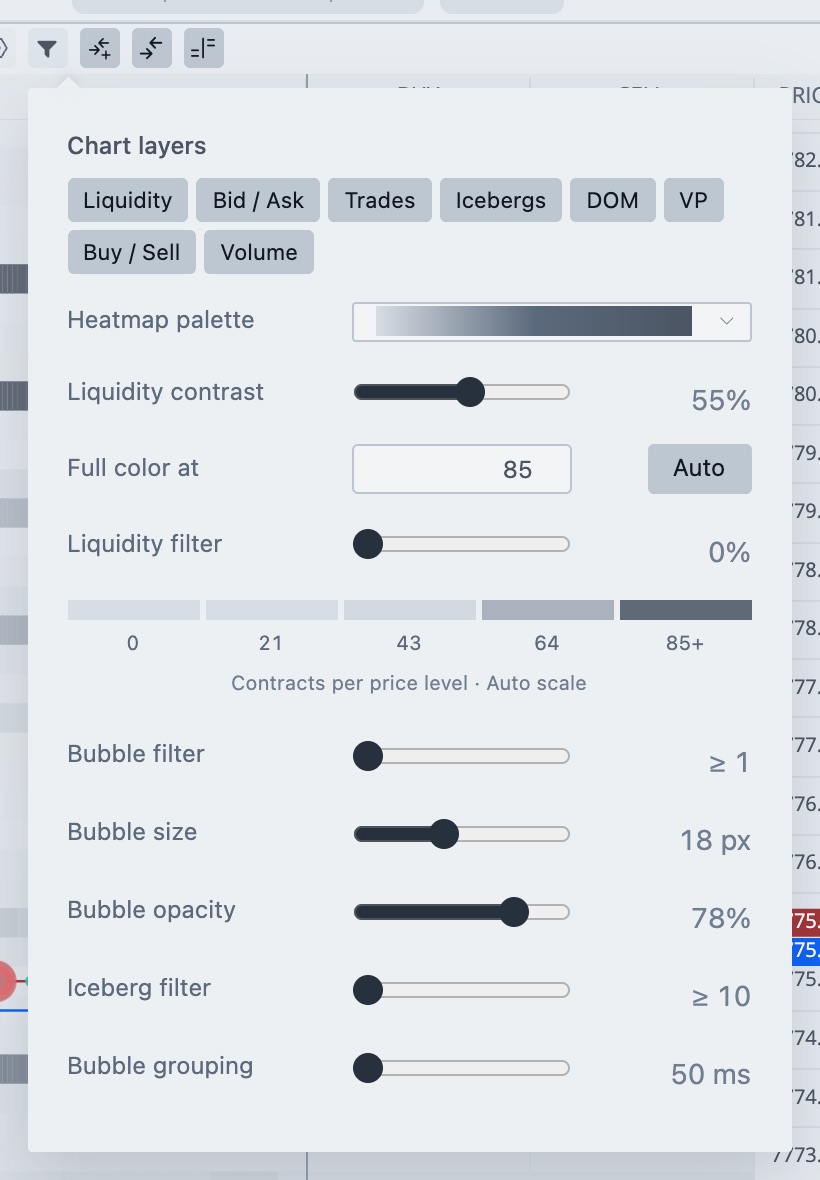
Click Quick visual controls (the filter icon) to change the look without opening Settings. Changes show on the plot right away.
| Control | What it does |
|---|---|
| Chart layers | Toggle Liquidity, Bid / Ask, Trades, Icebergs, DOM, VP, Buy / Sell and Volume. |
| Heatmap palette | Color scheme of the shading. |
| Liquidity contrast | How strongly the shading stands out. |
| Full color at | The number of contracts where the shading reaches full color. Auto picks it for you. |
| Liquidity filter | Hides the thinnest liquidity. |
| Bubble filter, Bubble size, Bubble opacity | Smallest trade shown, bubble size and transparency. |
| Iceberg filter | Smallest observed size that gets an iceberg marker. |
| Bubble grouping | Merges trades printed within this many milliseconds into one bubble. |
Settings
| Page | Setting | What it does | Default |
|---|---|---|---|
| General | Depth source | Standard depth or MBO (optional). Standard depth and trades work without MBO. MBO adds iceberg candidates matched by exchange order ID, if your connection provides it. | Standard depth |
| General | Depth levels per side | Bid and ask levels, from 1 to 200, up to what the feed has. | 50 |
| General | Show header panel | Shows the title bar buttons. | On |
| Appearance | Price font size | From 8 to 24. | 10 |
| Appearance | Heatmap palette and colors | Buy and sell bubble colors, bid and ask line colors. Bid and ask liquidity colors show up with the custom palette. | |
| Bubbles | Minimum contracts, Maximum radius (px), Opacity (%) | Smallest trade shown, biggest bubble (3 to 40) and transparency. | 1, 18, 78 |
| Bubbles | Show sizes inside larger bubbles | Prints the size inside big bubbles. | Off |
| Icebergs | Show iceberg markers, Minimum observed contracts | Turns markers on and sets the smallest size shown. | On, 10 |
| Liquidity | Full color at (contracts), Contrast (%), Opacity (%) | Scale and strength of the shading. | Auto, 55, 85 |
| Columns | Show DOM, DOM width, Show VP, VP width, VP session | Column visibility and width (64 to 240 px). Drag a column header to reorder, or its right edge to resize. | On, 96 px, On, 110 px |
| Trading | Show trading panel and the options under it | See below. | Off |
A blue diamond on the plot marks a passive execution that got refilled with the same order ID. The first number is the executed volume we saw. The number in brackets is the largest displayed refill. New candidates need MBO depth.
Trade from LiquidityMap
Chart trading is off by default. Turn it on with Chart trading in the title bar, or Show trading panel in Settings → Trading.
- Click Buy or Sell at a price to place an order with the type and quantity set in the trading panel.
- Hold Shift over Buy or Sell for a stop market order.
- Drag an order label to change its price. Click its × to cancel.
- Grouped labels show total quantity and order count. Drag the combined label to move the group, or hover one label to move or cancel just that order.
Settings → Trading also has Show P/L Info, Show R/PL, Order value ($, Points or Ticks), Order and position alignment, Trade panel width (Narrow, Normal, Wide), the quick order buttons, Show Liquidate Button, Show Cancel All Button and Default time in force (DAY or GTC).
Careful. Orders from LiquidityMap follow the trading lock and your Risk Manager limits, same as any other window. The window has its own lock icon too.
Related articles
Was this article helpful?