Big Trades Beta
Big Trades marks the prices where a lot of volume traded. It draws a circle on the candle chart at each of those prices, and a bigger circle means more volume.
Beta. Big Trades is in beta. Settings and behavior may change.
- Shows
- Circles at prices with large volume, sized by volume
- Updates
- Live, as trades arrive in the current bar
- Best on
- Time charts
What it measures
For each bar, Big Trades looks at the volume traded at each price level. A level that reaches Min. Volume gets a circle on that bar at that price. The size is the volume at one price in one bar, not a single order.
- Total Volume uses the buy and sell volume at the price added together.
- Bid Volume uses only the volume that traded at the bid (sellers).
- Ask Volume uses only the volume that traded at the ask (buyers).
- Delta uses the difference between ask and bid volume, always shown as a positive size.
The biggest size gets the largest circle. To keep the chart readable, each bar shows at most its 8 biggest levels, and no more than 350 circles are drawn on screen. Circles show a size label only when they are large enough to hold it, and at most 80 labels appear at once.
On the chart
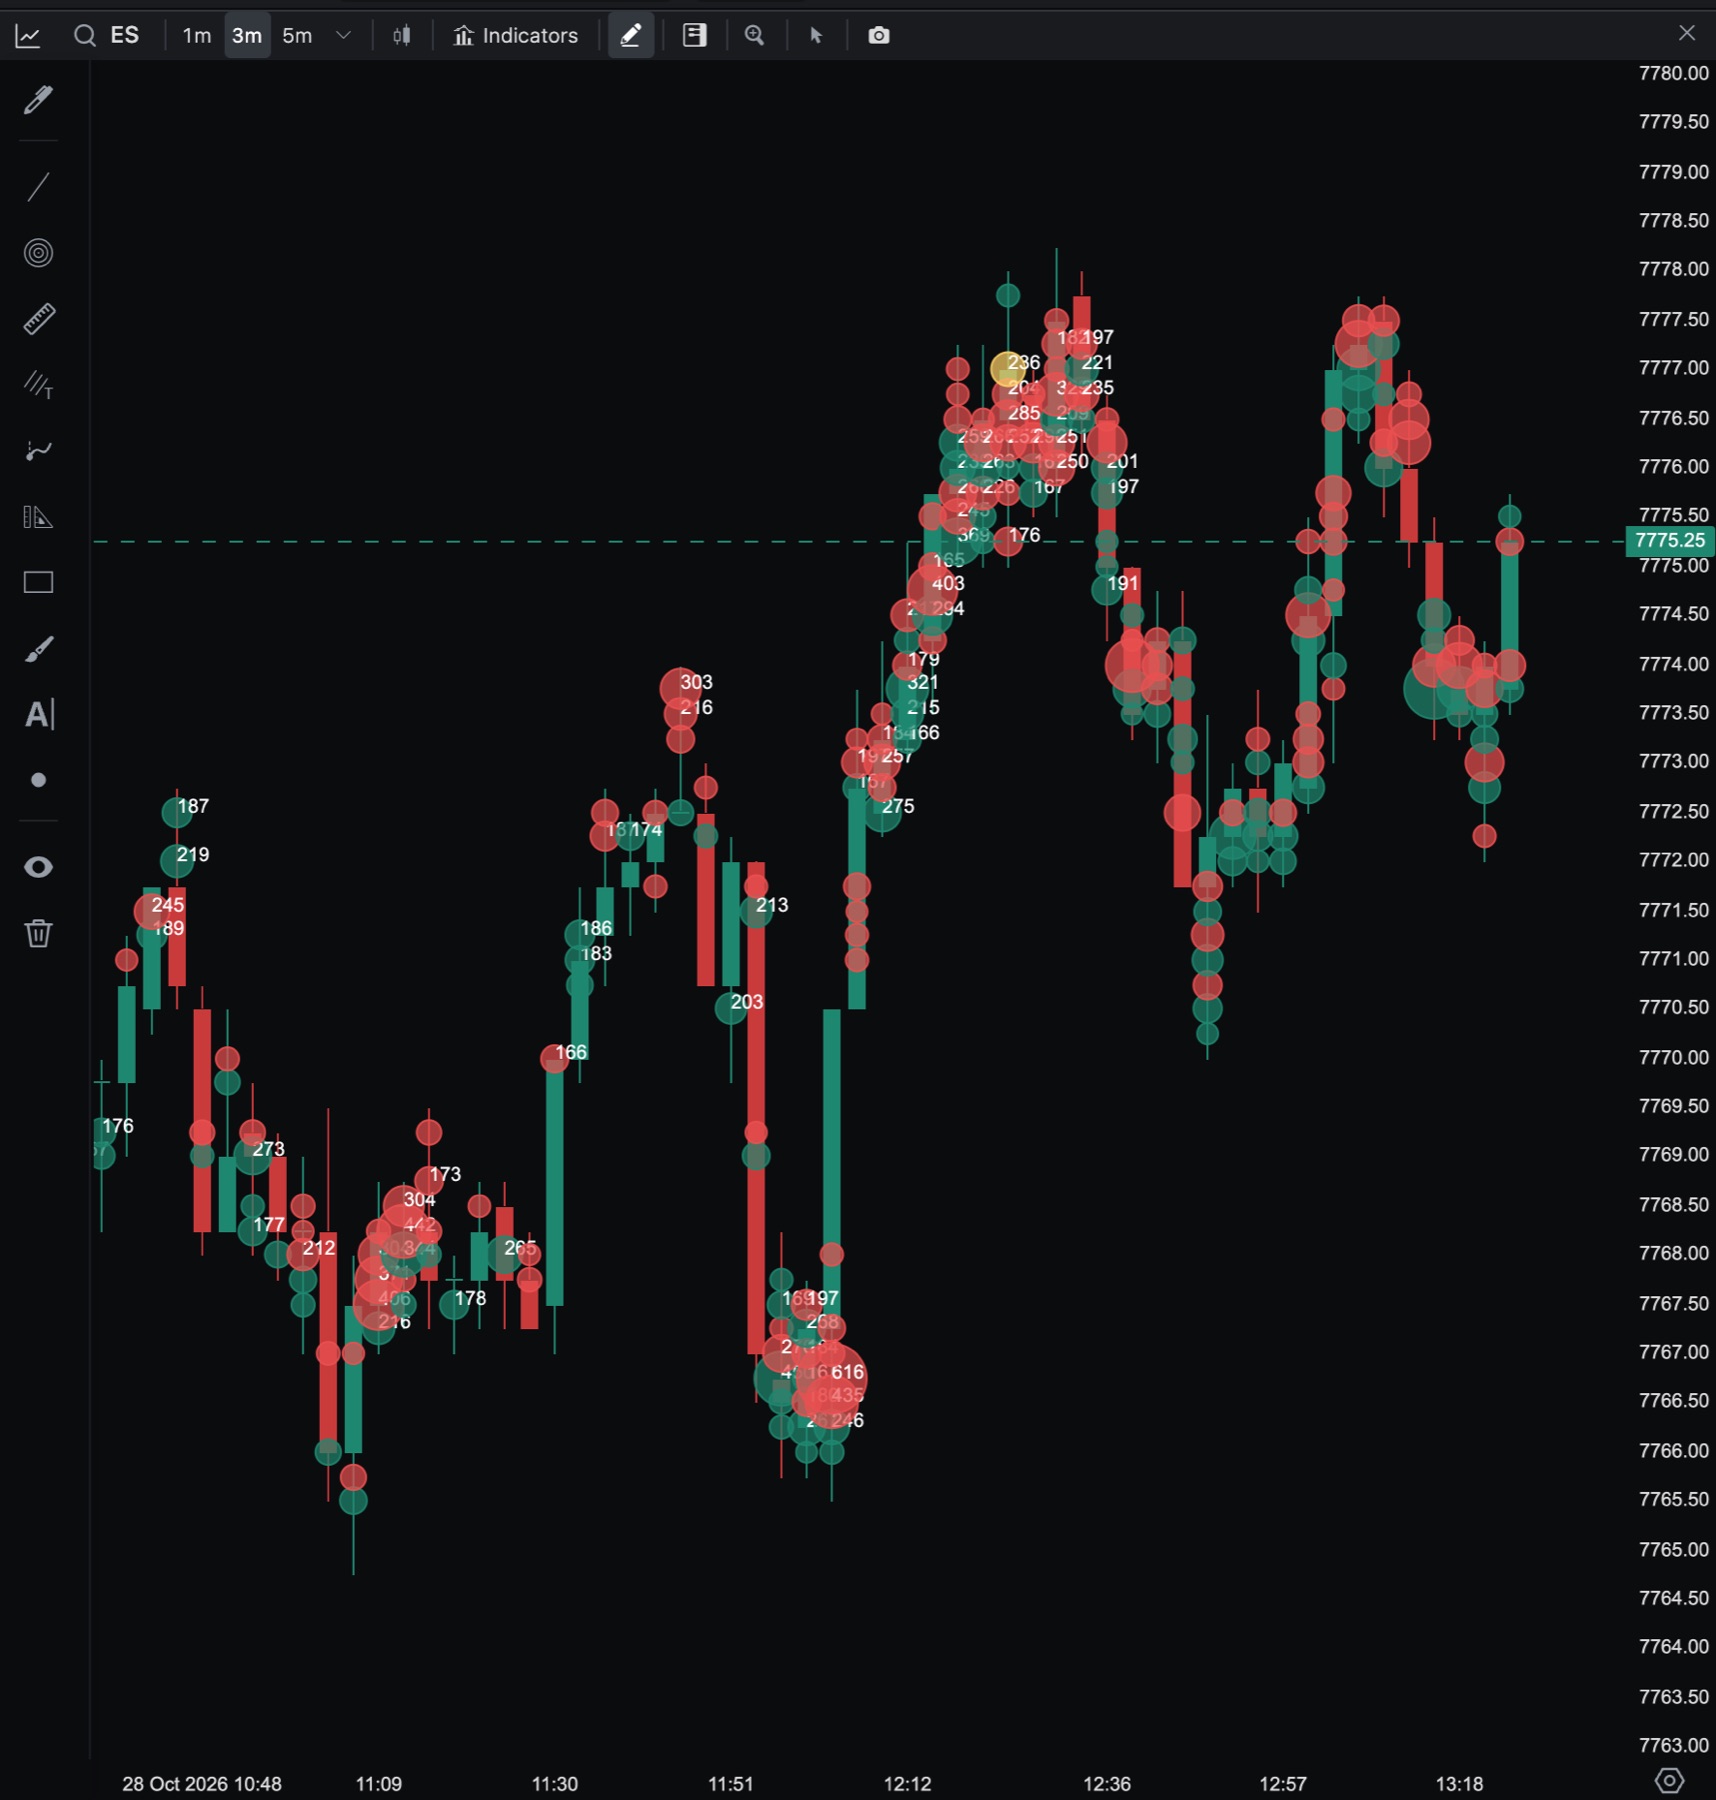
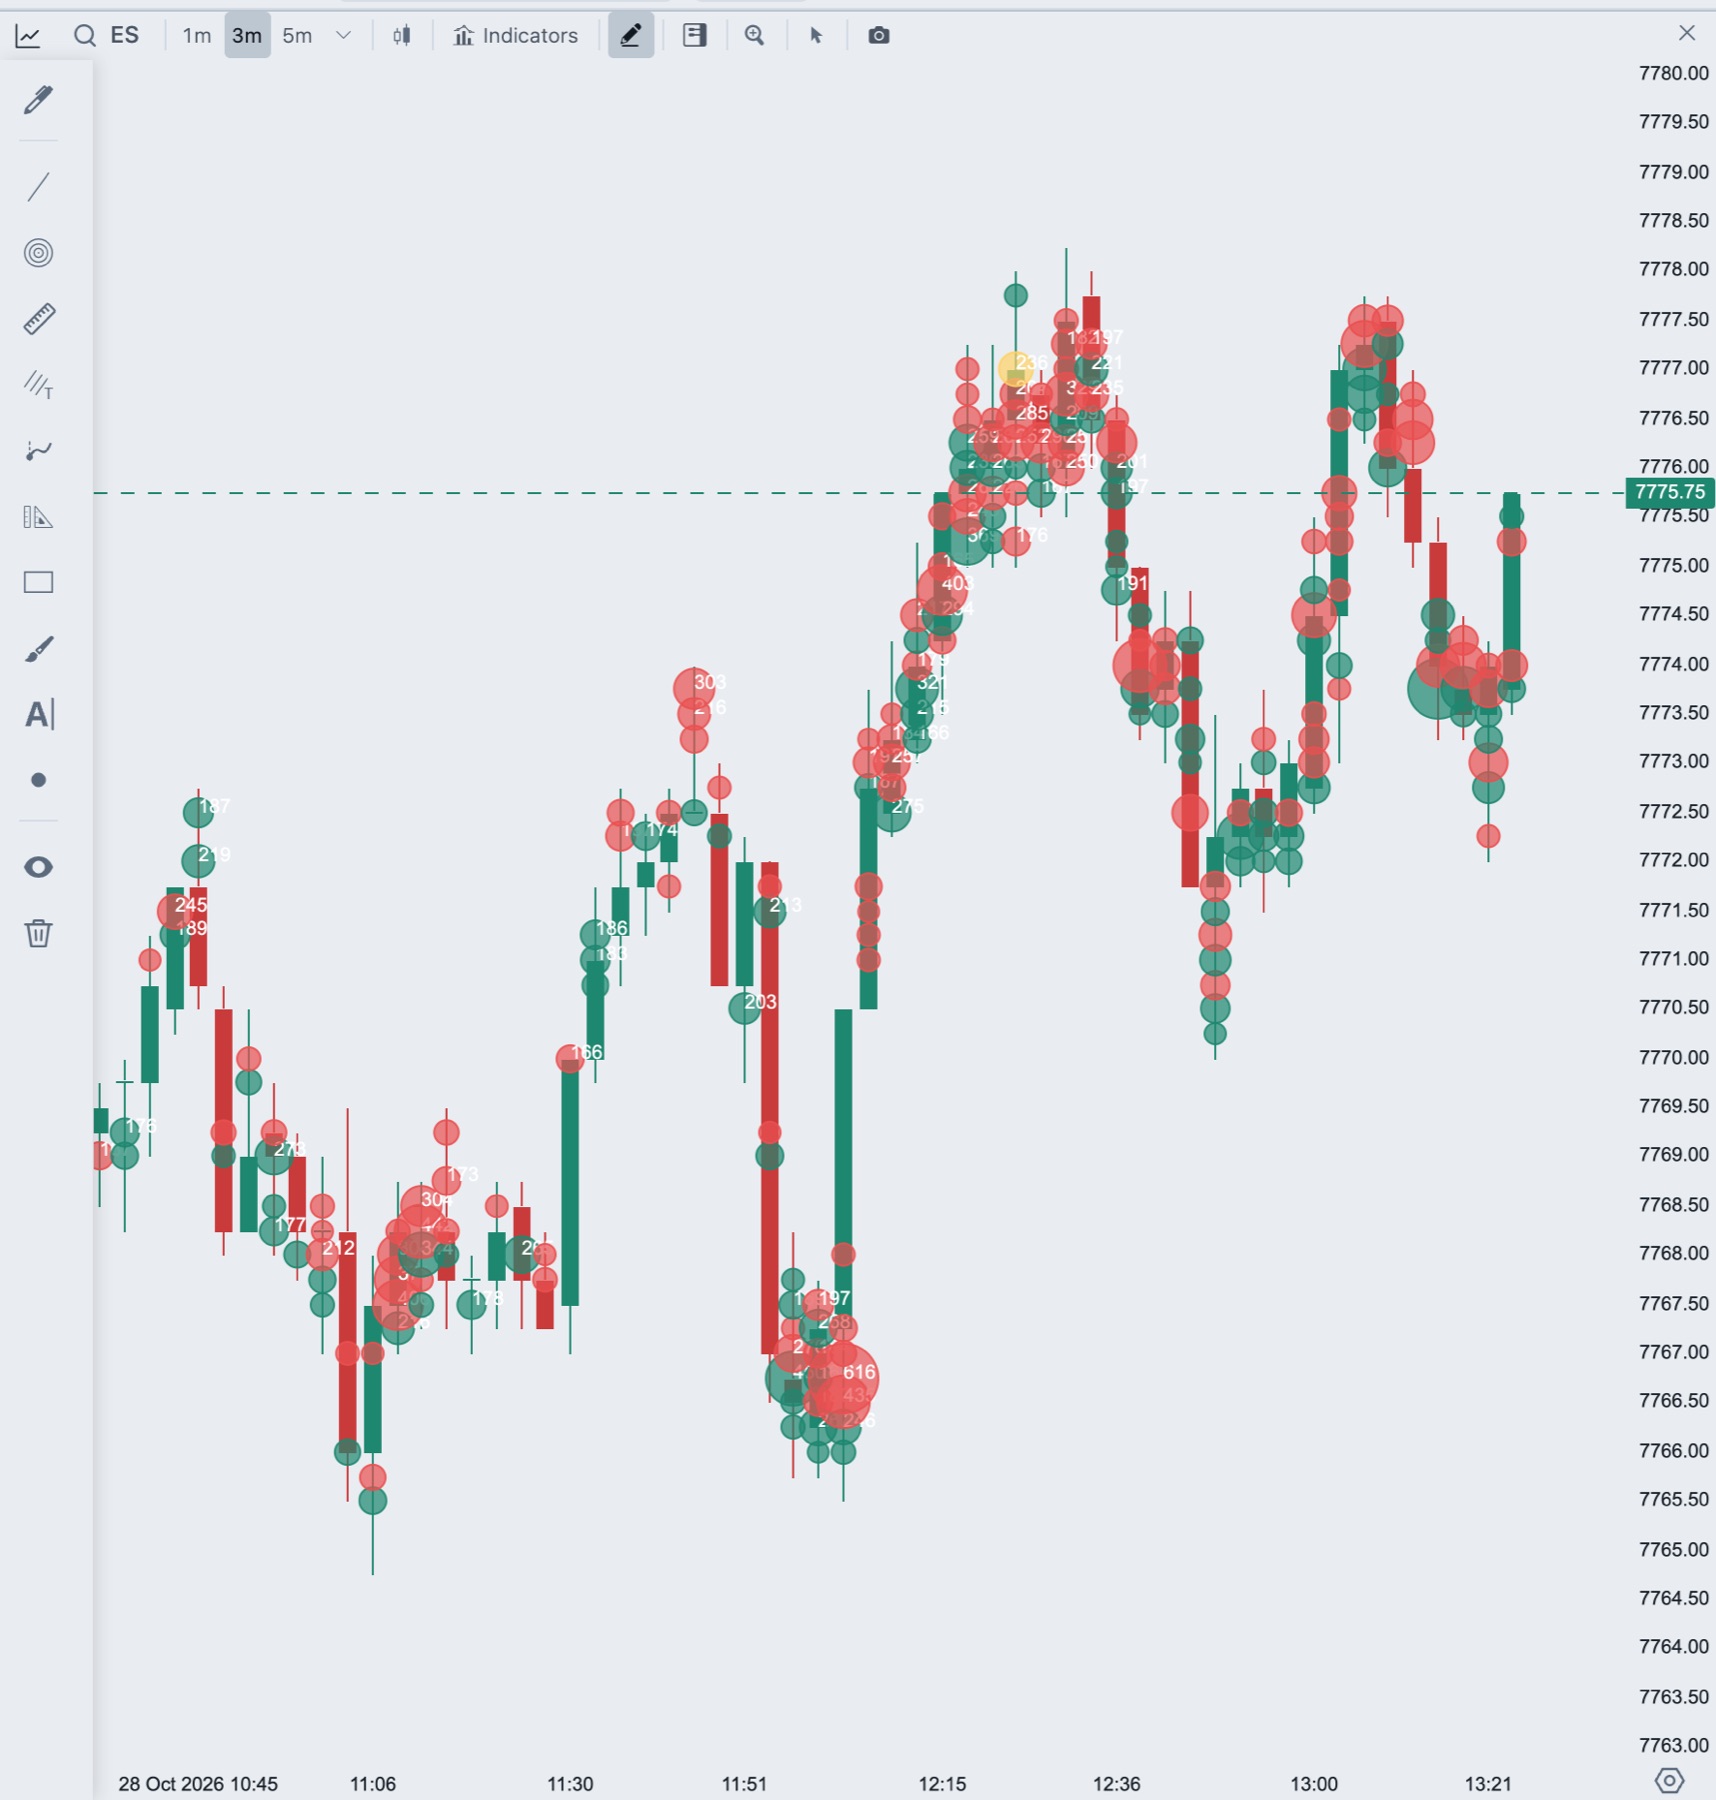
Add Big Trades to a chart
- In the chart header, click Indicators.
- Click BigTrades in the Tradrr group. It carries a BETA tag.
- Change the settings on the right. Start with Min. Volume.
Big Trades allows one copy per chart and is not available on tick charts. When you add it, Tradrr loads extra tick history for the chart, so circles may take a moment to appear.
Settings
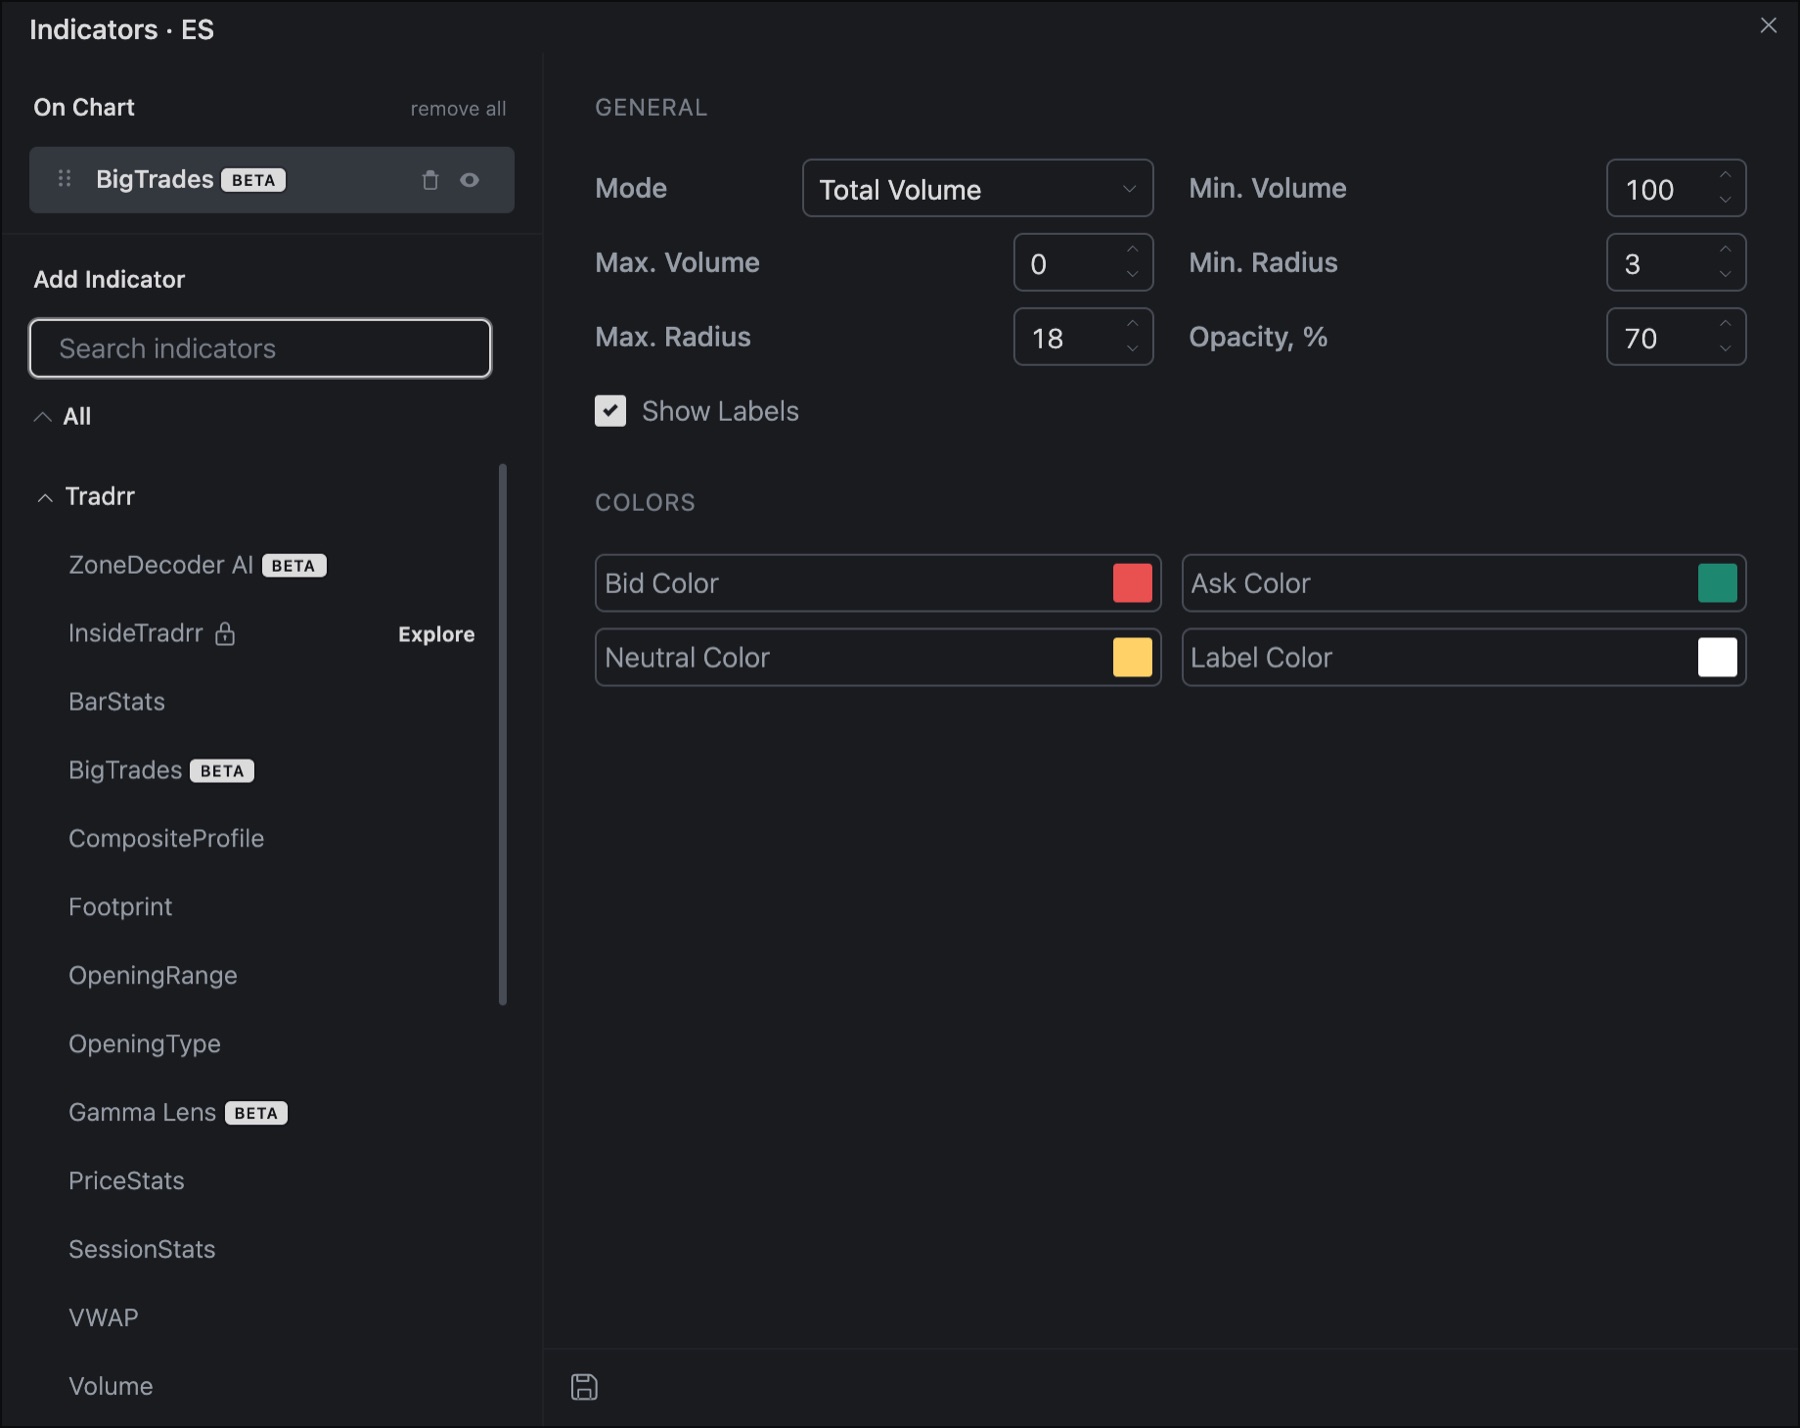
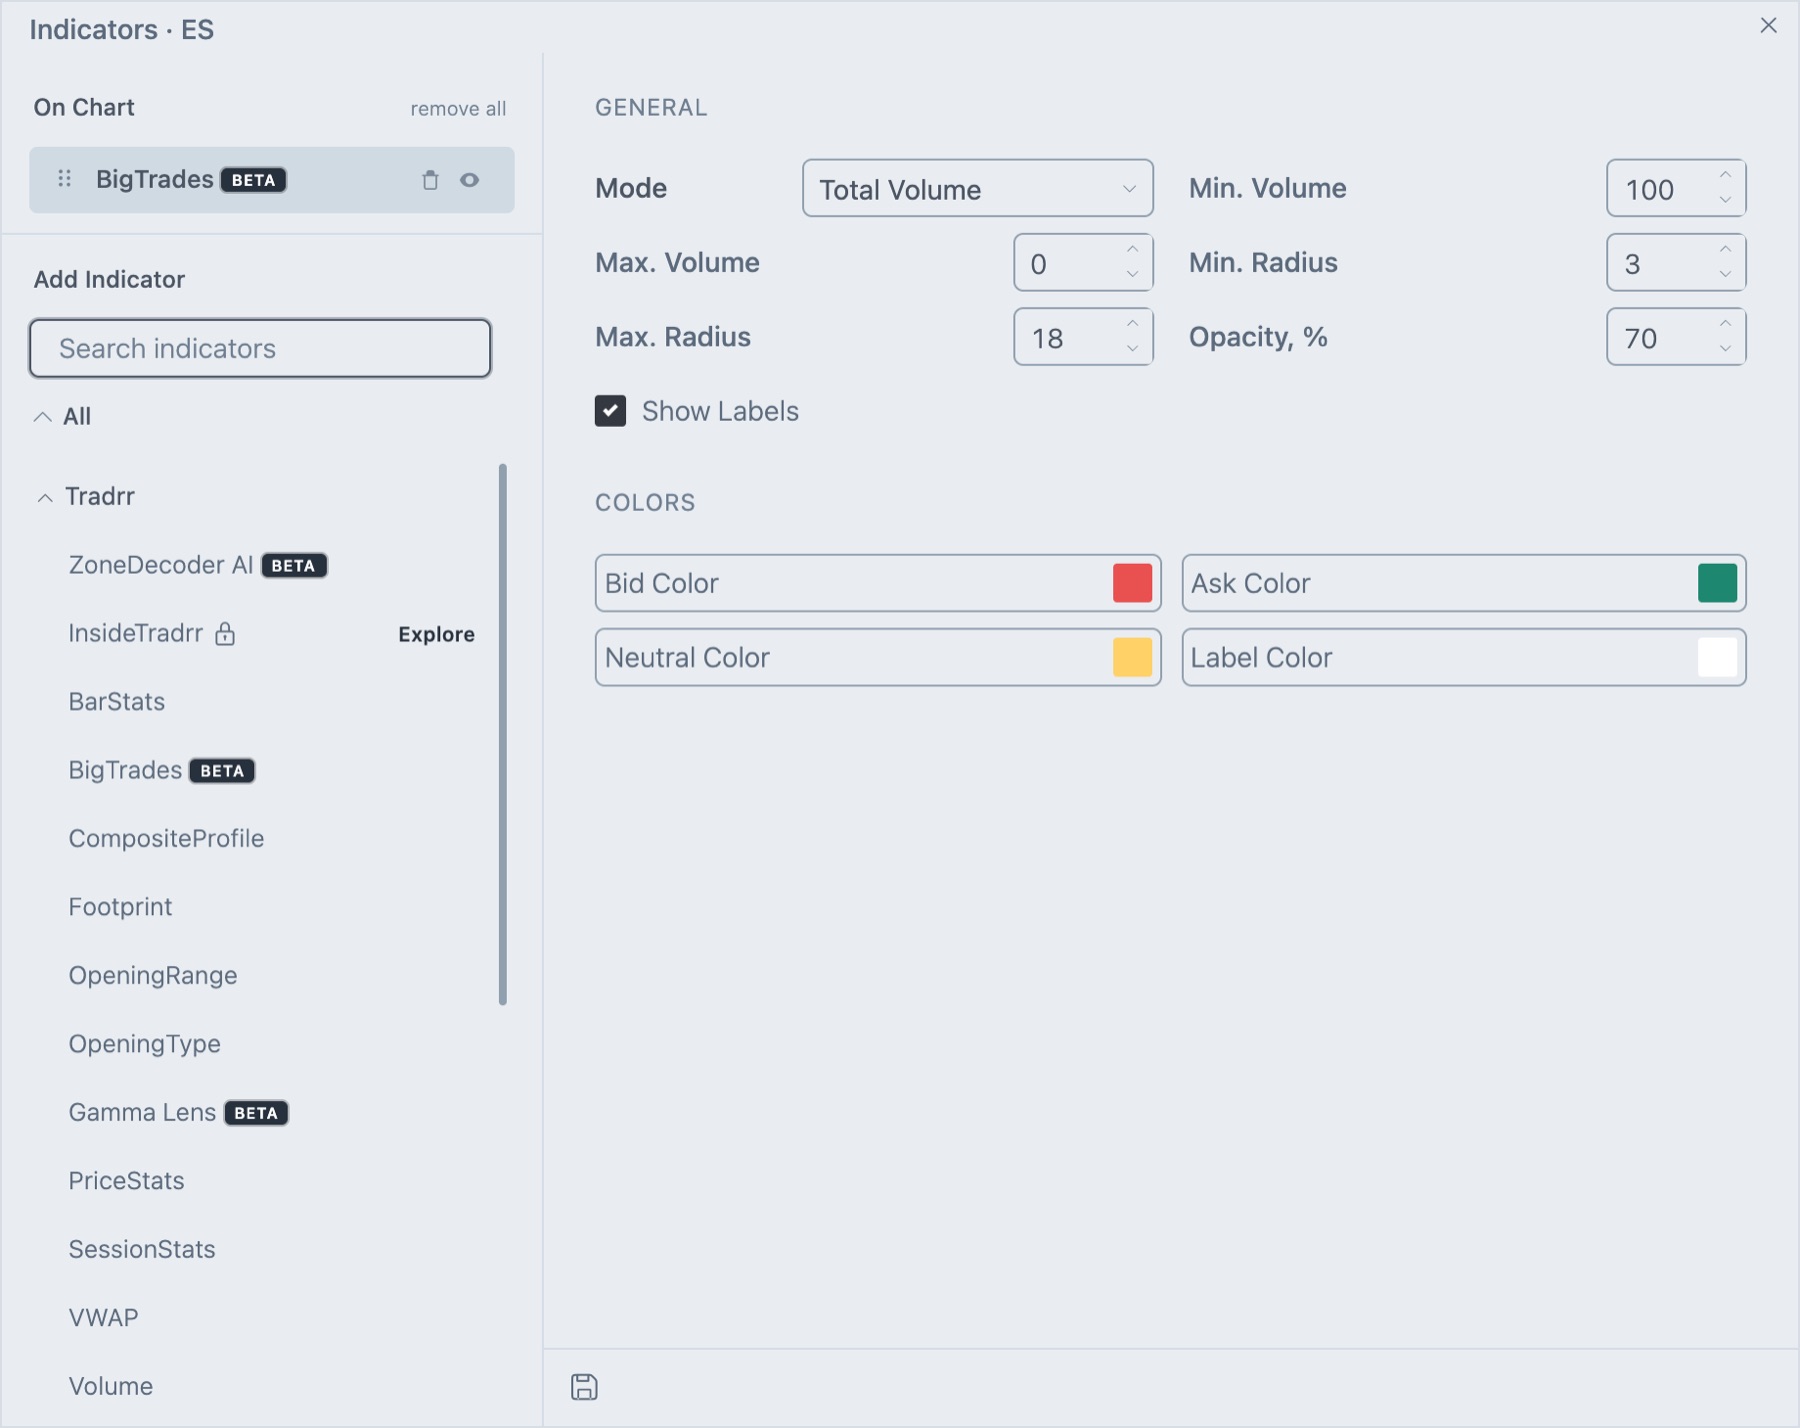
General
| Setting | What it does | Default |
|---|---|---|
| Mode | What the size is made of: Total Volume, Bid Volume, Ask Volume or Delta. | Total Volume |
| Min. Volume | Levels below this size get no circle. | 100 |
| Max. Volume | The size that gets the largest circle. Larger sizes use the same circle. Leave at 0 to scale to the biggest size currently on screen. | 0 |
| Min. Radius | Radius in pixels of the smallest circle. Minimum 1. | 3 |
| Max. Radius | Radius in pixels of the largest circle. Minimum 1. | 18 |
| Opacity, % | How solid the circles are, 0 to 100. | 70 |
| Show Labels | Writes the size inside circles that are big enough. | On |
Colors
| Setting | What it does | Default |
|---|---|---|
| Bid Color | Circles where bid volume was larger, and every circle in Bid Volume mode. | Red |
| Ask Color | Circles where ask volume was larger or equal, and every circle in Ask Volume mode. | Green |
| Neutral Color | Circles in Total Volume mode where bid and ask volume were equal. | Yellow |
| Label Color | Color of the size labels. | White |
How traders read it
- Large circles at turning points: heavy trading at a high or low can mark where the move met strong interest.
- Color by side: a large ask-colored circle shows buyers lifting the ask. A bid-colored one shows sellers hitting the bid.
- Clusters: a row of large circles at the same price shows the market returning to that level.
Tip. Raise Min. Volume on busy instruments until only the real standouts remain. Open Footprint on the same bar to see the bid and ask split behind a circle.
Related articles
Was this article helpful?