Volume Profile
Volume Profile shows how much volume traded at each price during a period. It turns the day's trading into a histogram beside the candles, so you can see where the market accepted price and where it moved through quickly.
- Shows
- A volume histogram per period, with POC and value area lines
- Resets
- At the end of each period. The default is every 1 day
- Best on
- Intraday time charts
What it measures
The profile adds up the volume traded at each price level over the period you choose. Longer bars mean more volume at that price.
- Point of control (POC) is the price with the most volume.
- Value area (VA) is the range around the POC that holds a set share of the volume. It starts at the POC and adds the next price above and below until it holds the share you set. The default is 70%.
- High and low of the value area are the VA High and VA Low.
With Split Profile on, each period gets two profiles: one for regular trading hours (RTH) and one for the rest of the day, the extended trading hours (ETH). Each has its own session, shape, color and lines. Above each profile, a summary shows Vol (total volume), Rng (high minus low) and Ch (close minus open).
On the chart
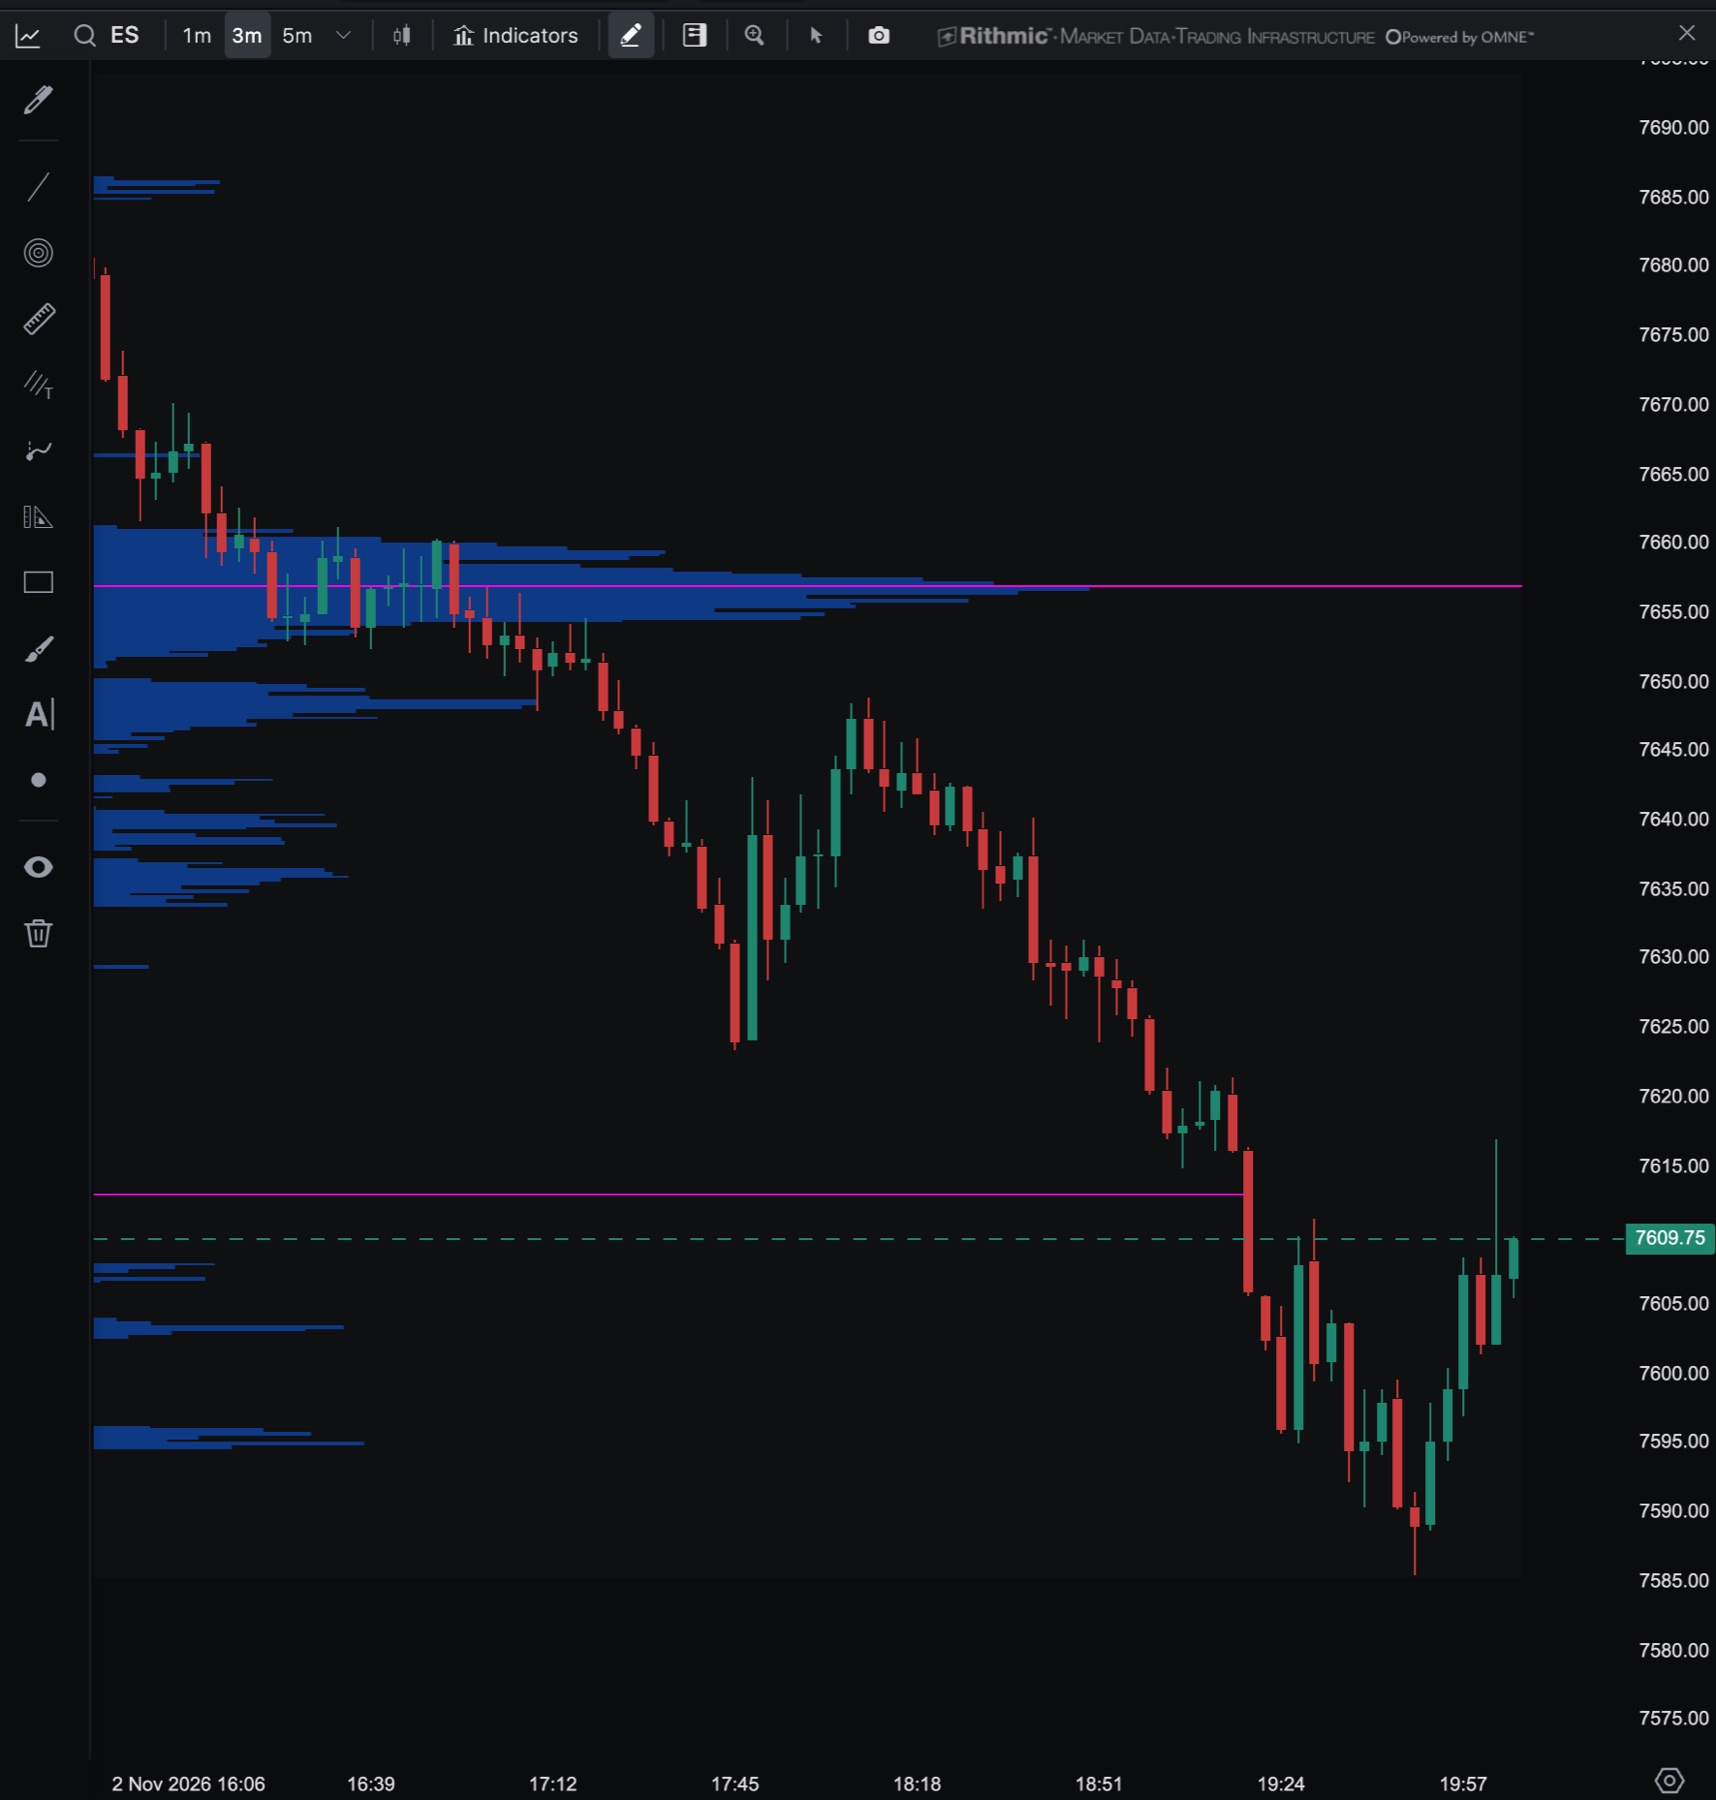
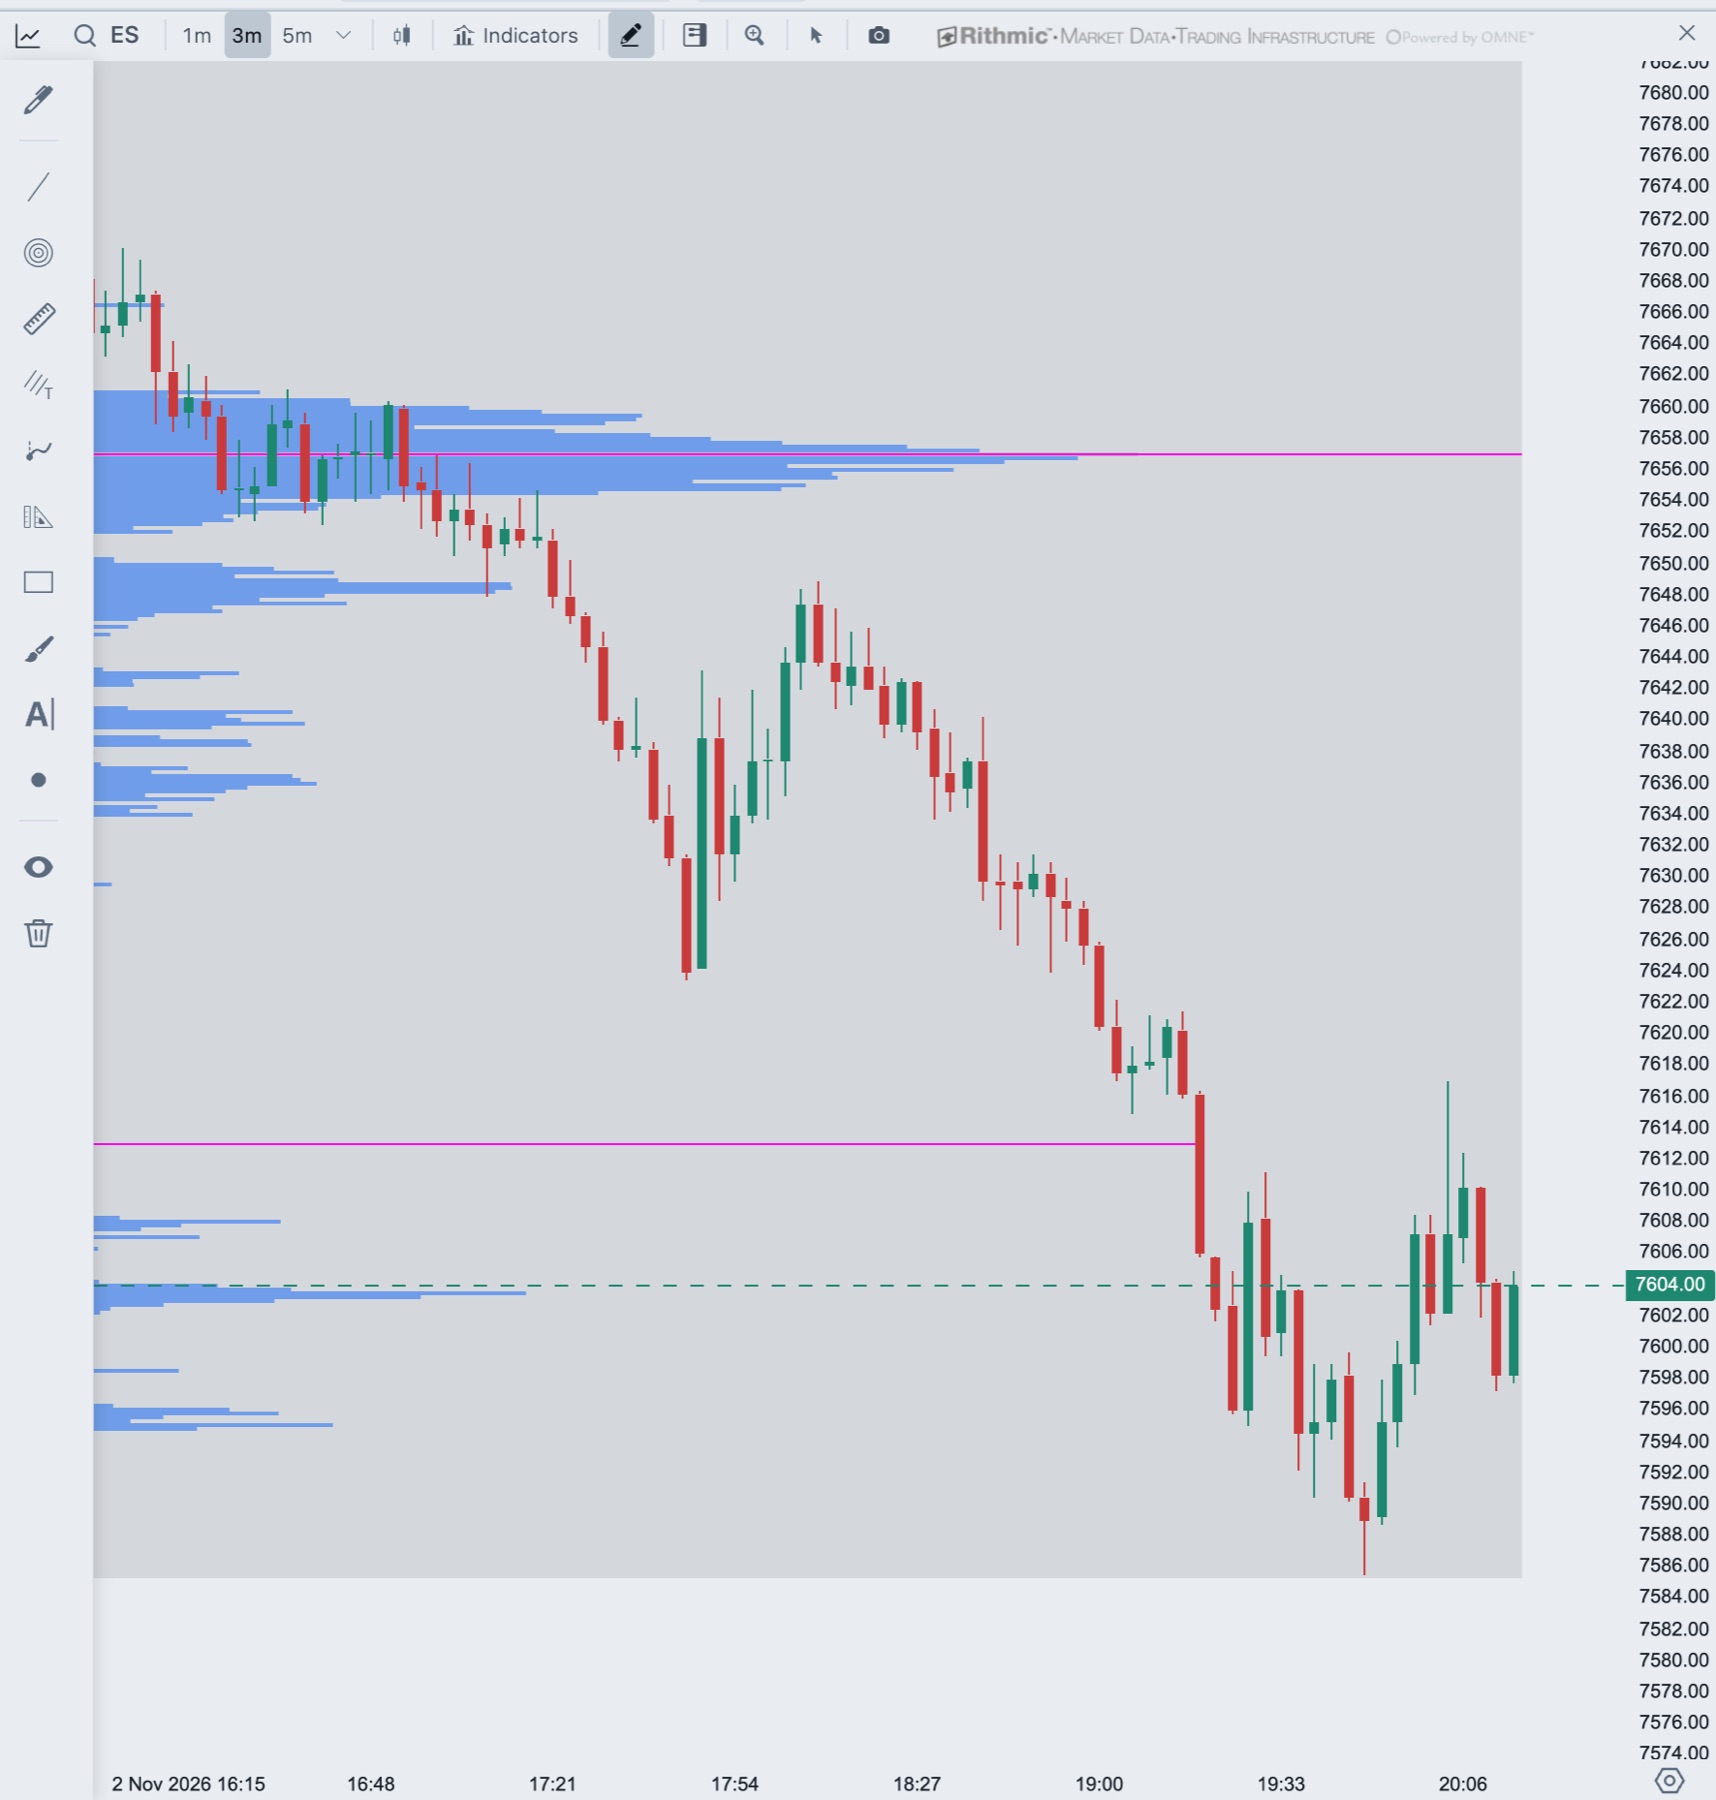
Add Volume Profile to a chart
- In the chart header, click Indicators.
- Type
profilein Search indicators and click VolumeProfile. - Change the settings on the right.
Volume Profile allows one copy per chart and is not available on tick charts. For one profile over the whole chart, see Composite Profile.
Settings
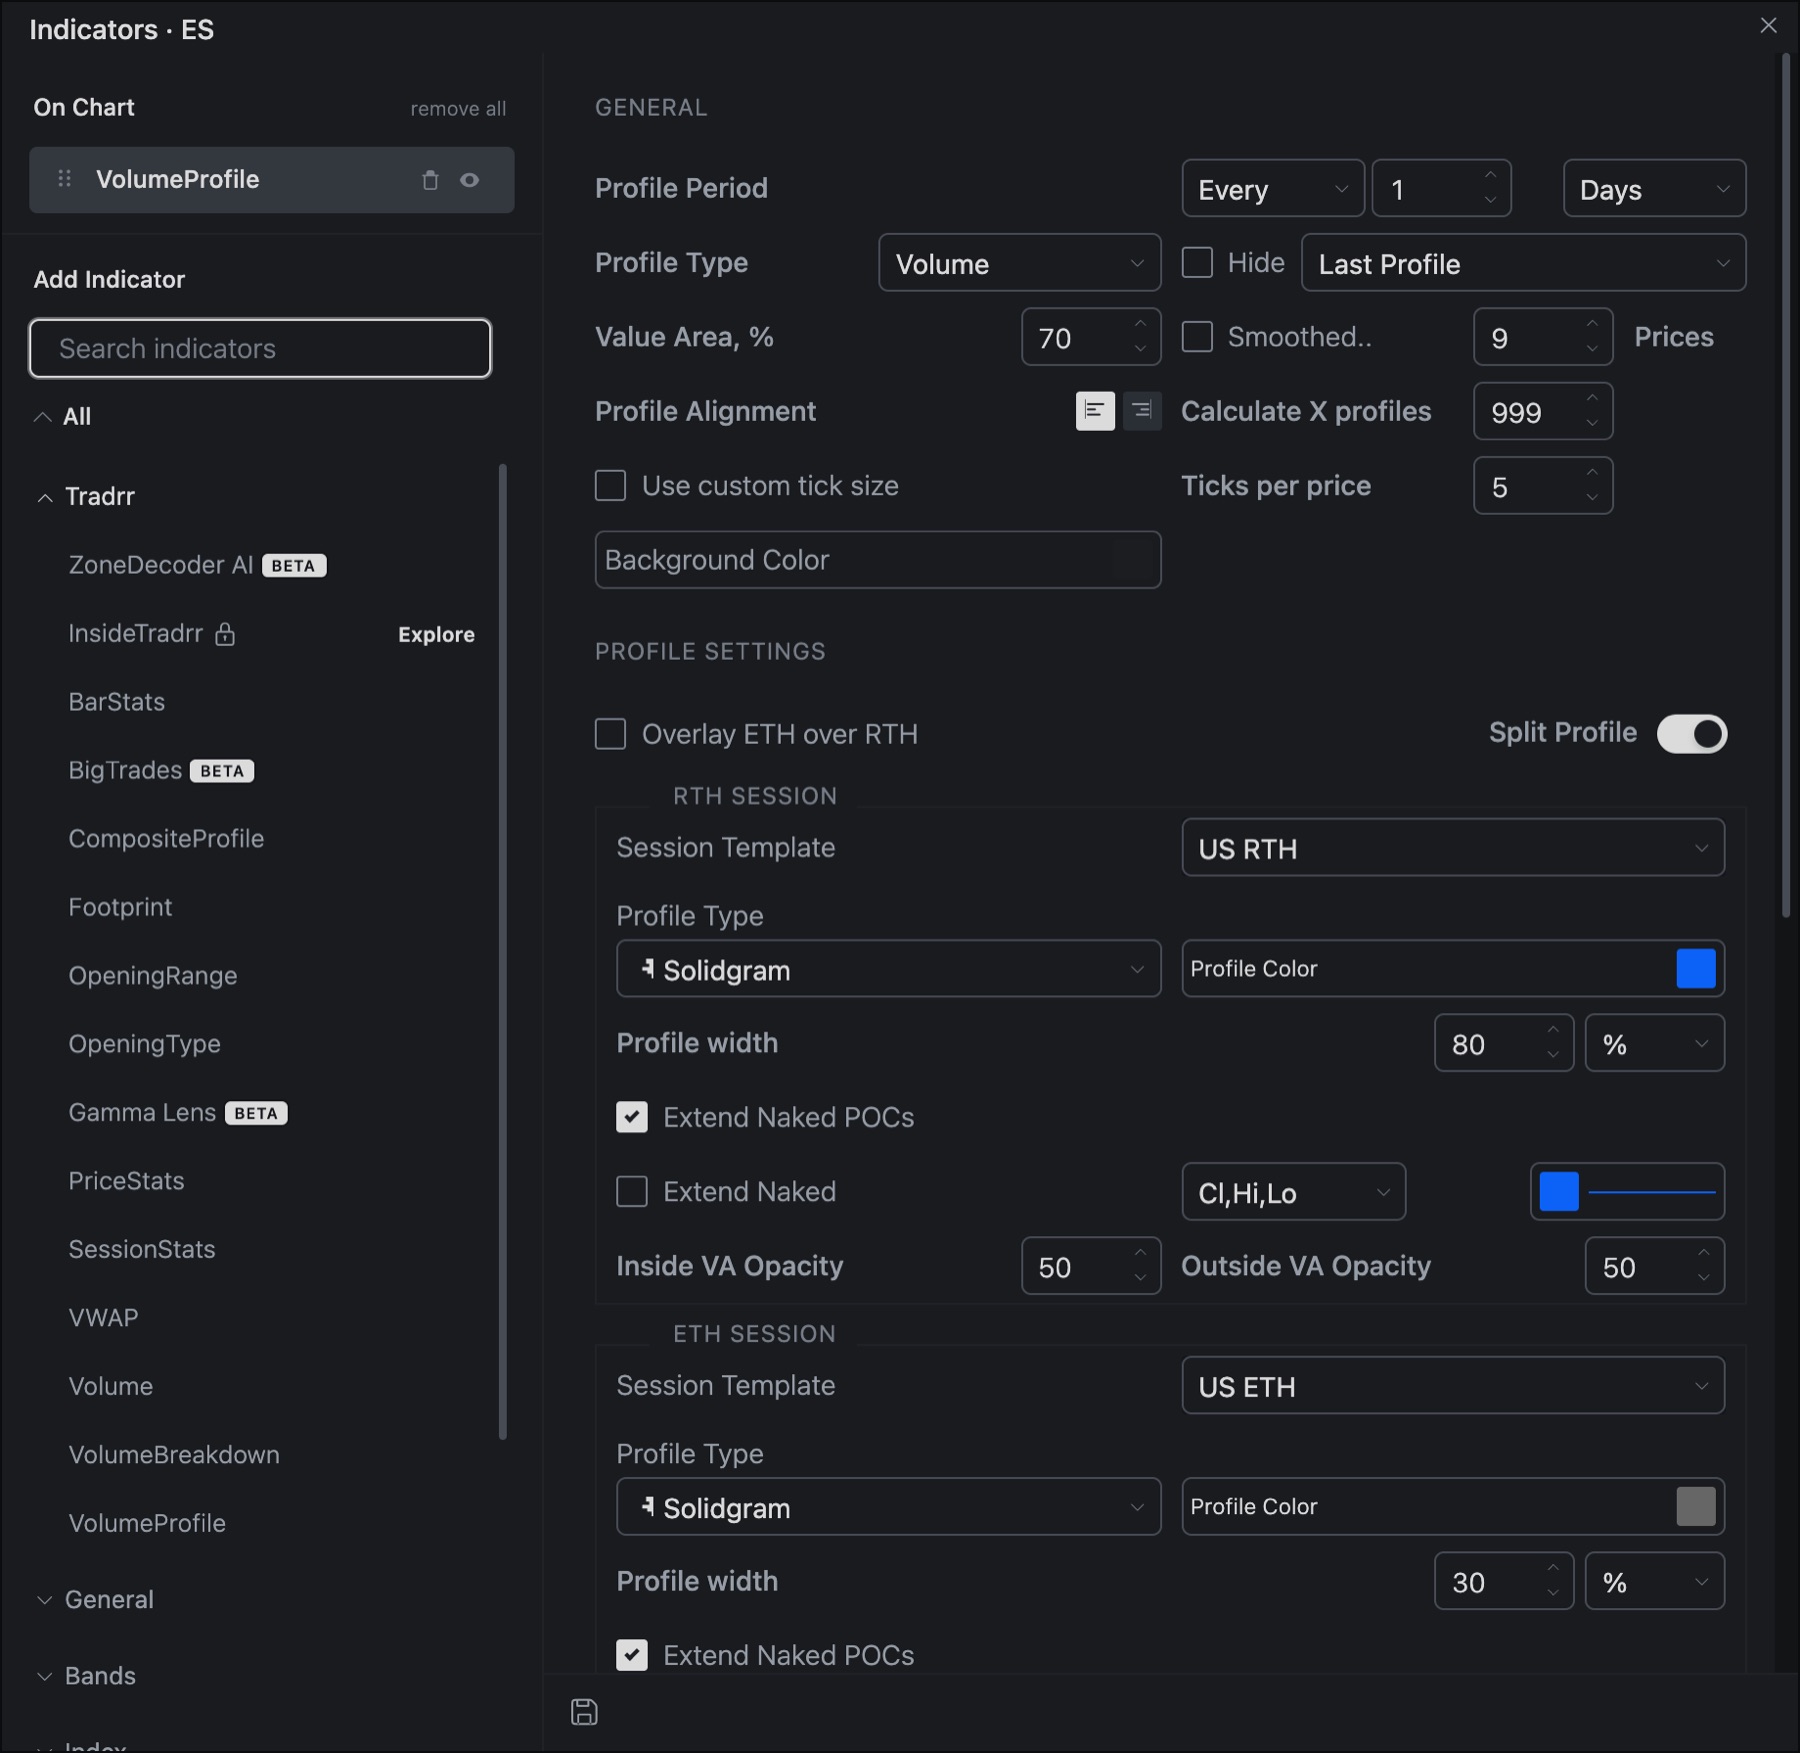
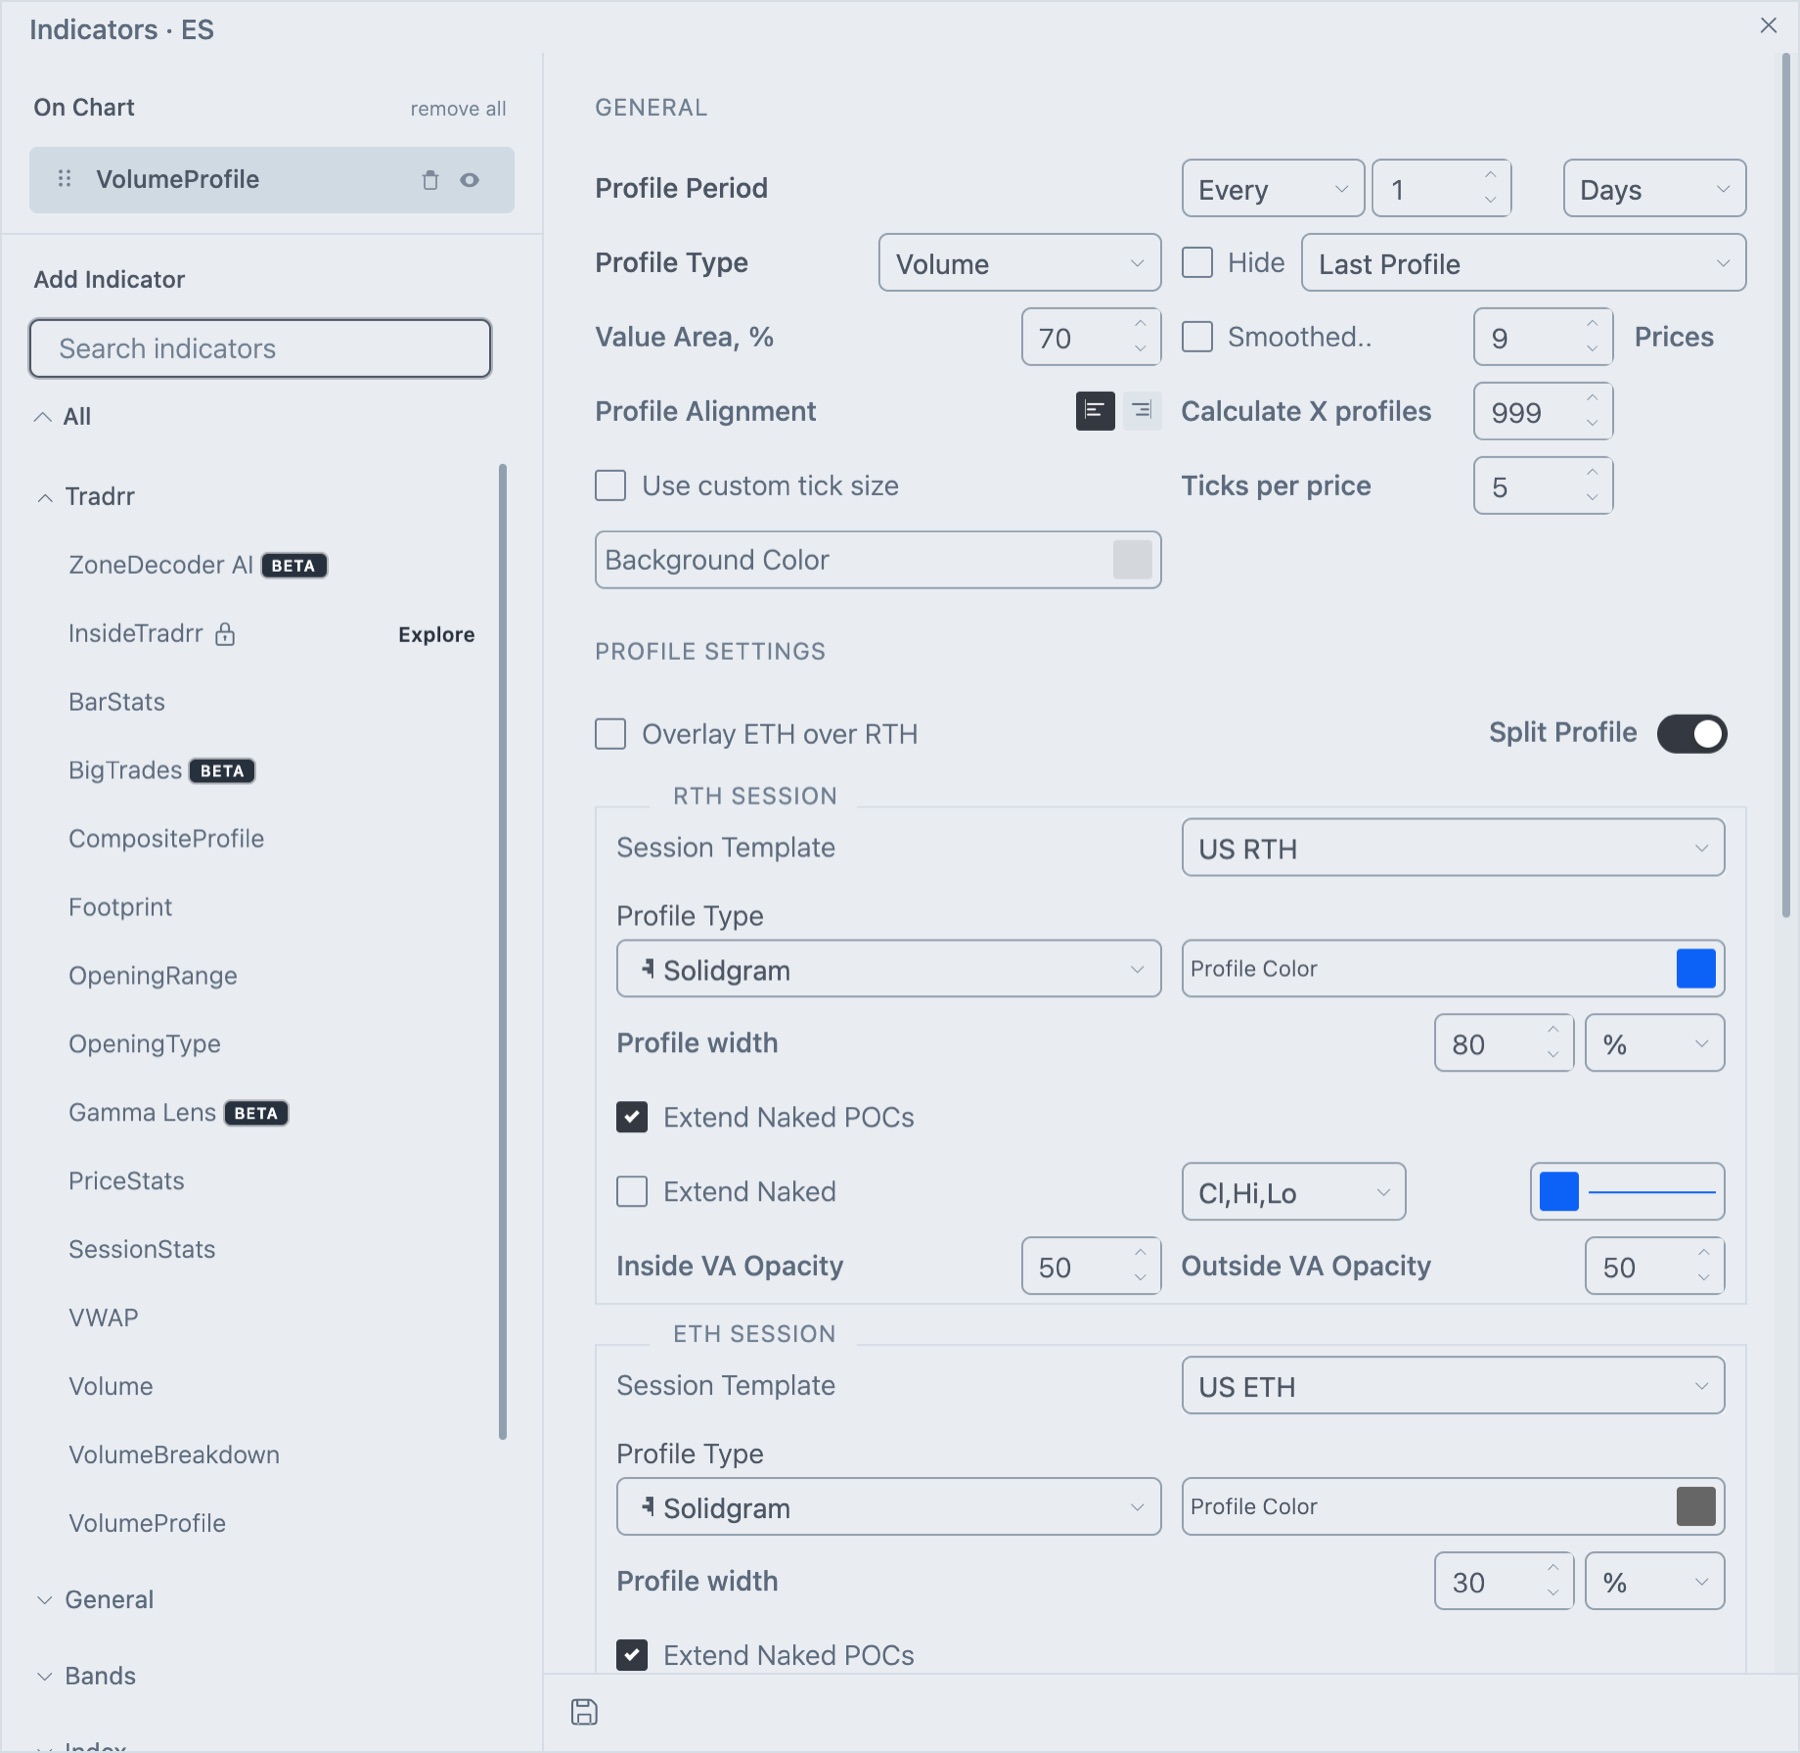
General
| Setting | What it does | Default |
|---|---|---|
| Profile Period | How the chart is divided into profiles. Choose Last or Every, enter a number, then pick a unit: Bars, Minutes, Days, Weeks, Month, Quarters or Years. To Present builds one profile from a date you pick to now. All Bars and Visible Bars build one profile from all or the visible bars. | Every 1 Days |
| Profile Type | Volume adds contracts traded. Ticks adds the number of trades. Price is also listed. | Volume |
| Hide | Tick the box and choose Last Profile or All Profiles to hide those profiles. | Off |
| Value Area, % | Share of volume the value area holds, 0 to 100. | 70 |
| Smoothed.. | Smooths the profile across the number of Prices you enter. | Off, 9 prices |
| Profile Alignment | Two icon buttons. They draw profiles from the left or the right edge of the period. | Left |
| Calculate X profiles | The most recent number of profiles to calculate. Minimum 1. | 999 |
| Use custom tick size | Groups prices into rows of Ticks per price ticks each. | Off, 5 ticks |
| Background Color | Color of the box behind each profile. |
Profile Settings
Turn on Split Profile to set the RTH and ETH profiles separately. The two blocks are named RTH Session and ETH Session. With the switch off, one block applies to the whole period. With it on, Overlay ETH over RTH appears and draws the ETH profile on top of the RTH profile.
| Setting | What it does | Default |
|---|---|---|
| Split Profile | Gives RTH and ETH their own profile settings. | On |
| Overlay ETH over RTH | Draws the ETH profile over the RTH profile. Shown when Split Profile is on. | Off |
| Session Template | The trading hours the block covers. The defaults are the US RTH and US ETH sessions. Shown in the RTH Session and ETH Session blocks. | US RTH, US ETH |
| Profile Type | The shape: Hollow Blocks, Dots, Lines, Hollowgram, Solidgram, Filled Line, Hollow Line or Solid Block. | Solidgram |
| Color mode | The dropdown under the shape: Profile Color, Heat Map, Custom Blend or FP Shading. | Profile Color |
| Profile width | Width of the profile in px or %. In percent, the maximum is 100. | RTH 80%, ETH 30% |
| Extend Naked POCs | Extends a POC to the right until price trades through it. A POC that price has not revisited is called naked. | On |
| Extend Naked | Extends the Closes, the highs and lows (Hi&Lo) or all three (Cl,Hi,Lo) of each period until price trades through them. Set the color and line style beside it. | Off, Cl,Hi,Lo |
| Inside VA Opacity | Opacity of the profile inside the value area, 0 to 100. | 50 |
| Outside VA Opacity | Opacity of the profile outside the value area, 0 to 100. | 50 |
POC and Value Area Lines
Two columns, POC and Value Area (VA), each with three rows. Tick a box to draw the line, then set its color and line style. The same rows exist for RTH and ETH when Split Profile is on.
| Row | What it draws | Default |
|---|---|---|
| Current | The POC, or the VA high and low, of each period across that period. | POC on, VA off |
| Previous | The previous profile's POC or VA, carried into the current period. | Off |
| Dev | The developing POC or VA, which moves as the period builds. | Off |
Graphics
| Setting | What it does | Default |
|---|---|---|
| Summary: Enabled | Shows the Vol, Rng and Ch summary above each profile when there is room. | On |
| Summary Font | Font Open Sans or Monospace, weight Regular, Bold or Bolder, and size. | Open Sans, Regular, 12 |
| Summary Color | Color of the summary text. |
How traders read it
- High volume nodes: wide parts of the profile mark prices the market accepted. Price tends to slow or rotate there.
- Low volume areas: thin parts mark prices that traded quickly. Price often moves through them fast.
- POC and value area: traders watch whether price opens inside the previous value area, and whether it holds above or below it.
- Naked POCs: a POC that price has not revisited is often treated as a magnet.
Tip. Use the Previous row to carry yesterday's POC and value area into today without searching back for them. Compare them with VWAP for a second view of fair value.
Related articles
Was this article helpful?