Bar Stats
Bar Stats puts a small table of numbers under your bars. Each row is one statistic, like volume or delta, and each column is one bar. You get the numbers without opening a full footprint.
- Shows
- One column of figures per bar, in rows you pick
- Updates
- Live for the current bar
- Best on
- Time charts with bid and ask data
What it measures
Bar Stats reads the bid and ask volume at each price inside every bar and turns it into the rows below. It uses the same order flow data as Footprint.
| Row | What it shows |
|---|---|
| Delta | Ask volume minus bid volume for the bar. Positive means more buying. |
| Volume | Total volume of the bar. |
| Delta day | Delta added up since the start of the trading session. It restarts when a new session begins. |
| Delta% Day | Delta day as a percentage of the bar's volume. |
| Buy Volume, Sell Volume | The bar's volume split into its two sides. |
| Buy% Volume, Sell% Volume | Each side as a percentage of the bar's volume. The two add up to 100. |
| Delta Max, Delta Min | The largest and the smallest delta found at any single price inside the bar. |
| Delta Finish | Either Delta Max or Delta Min, chosen by comparing the bar's delta with them. |
| Ticks | The number of different prices traded inside the bar. |
In the table itself, some row names are spaced differently, for example Delta Day, Delta % Day and Buy % Volume.
On the chart
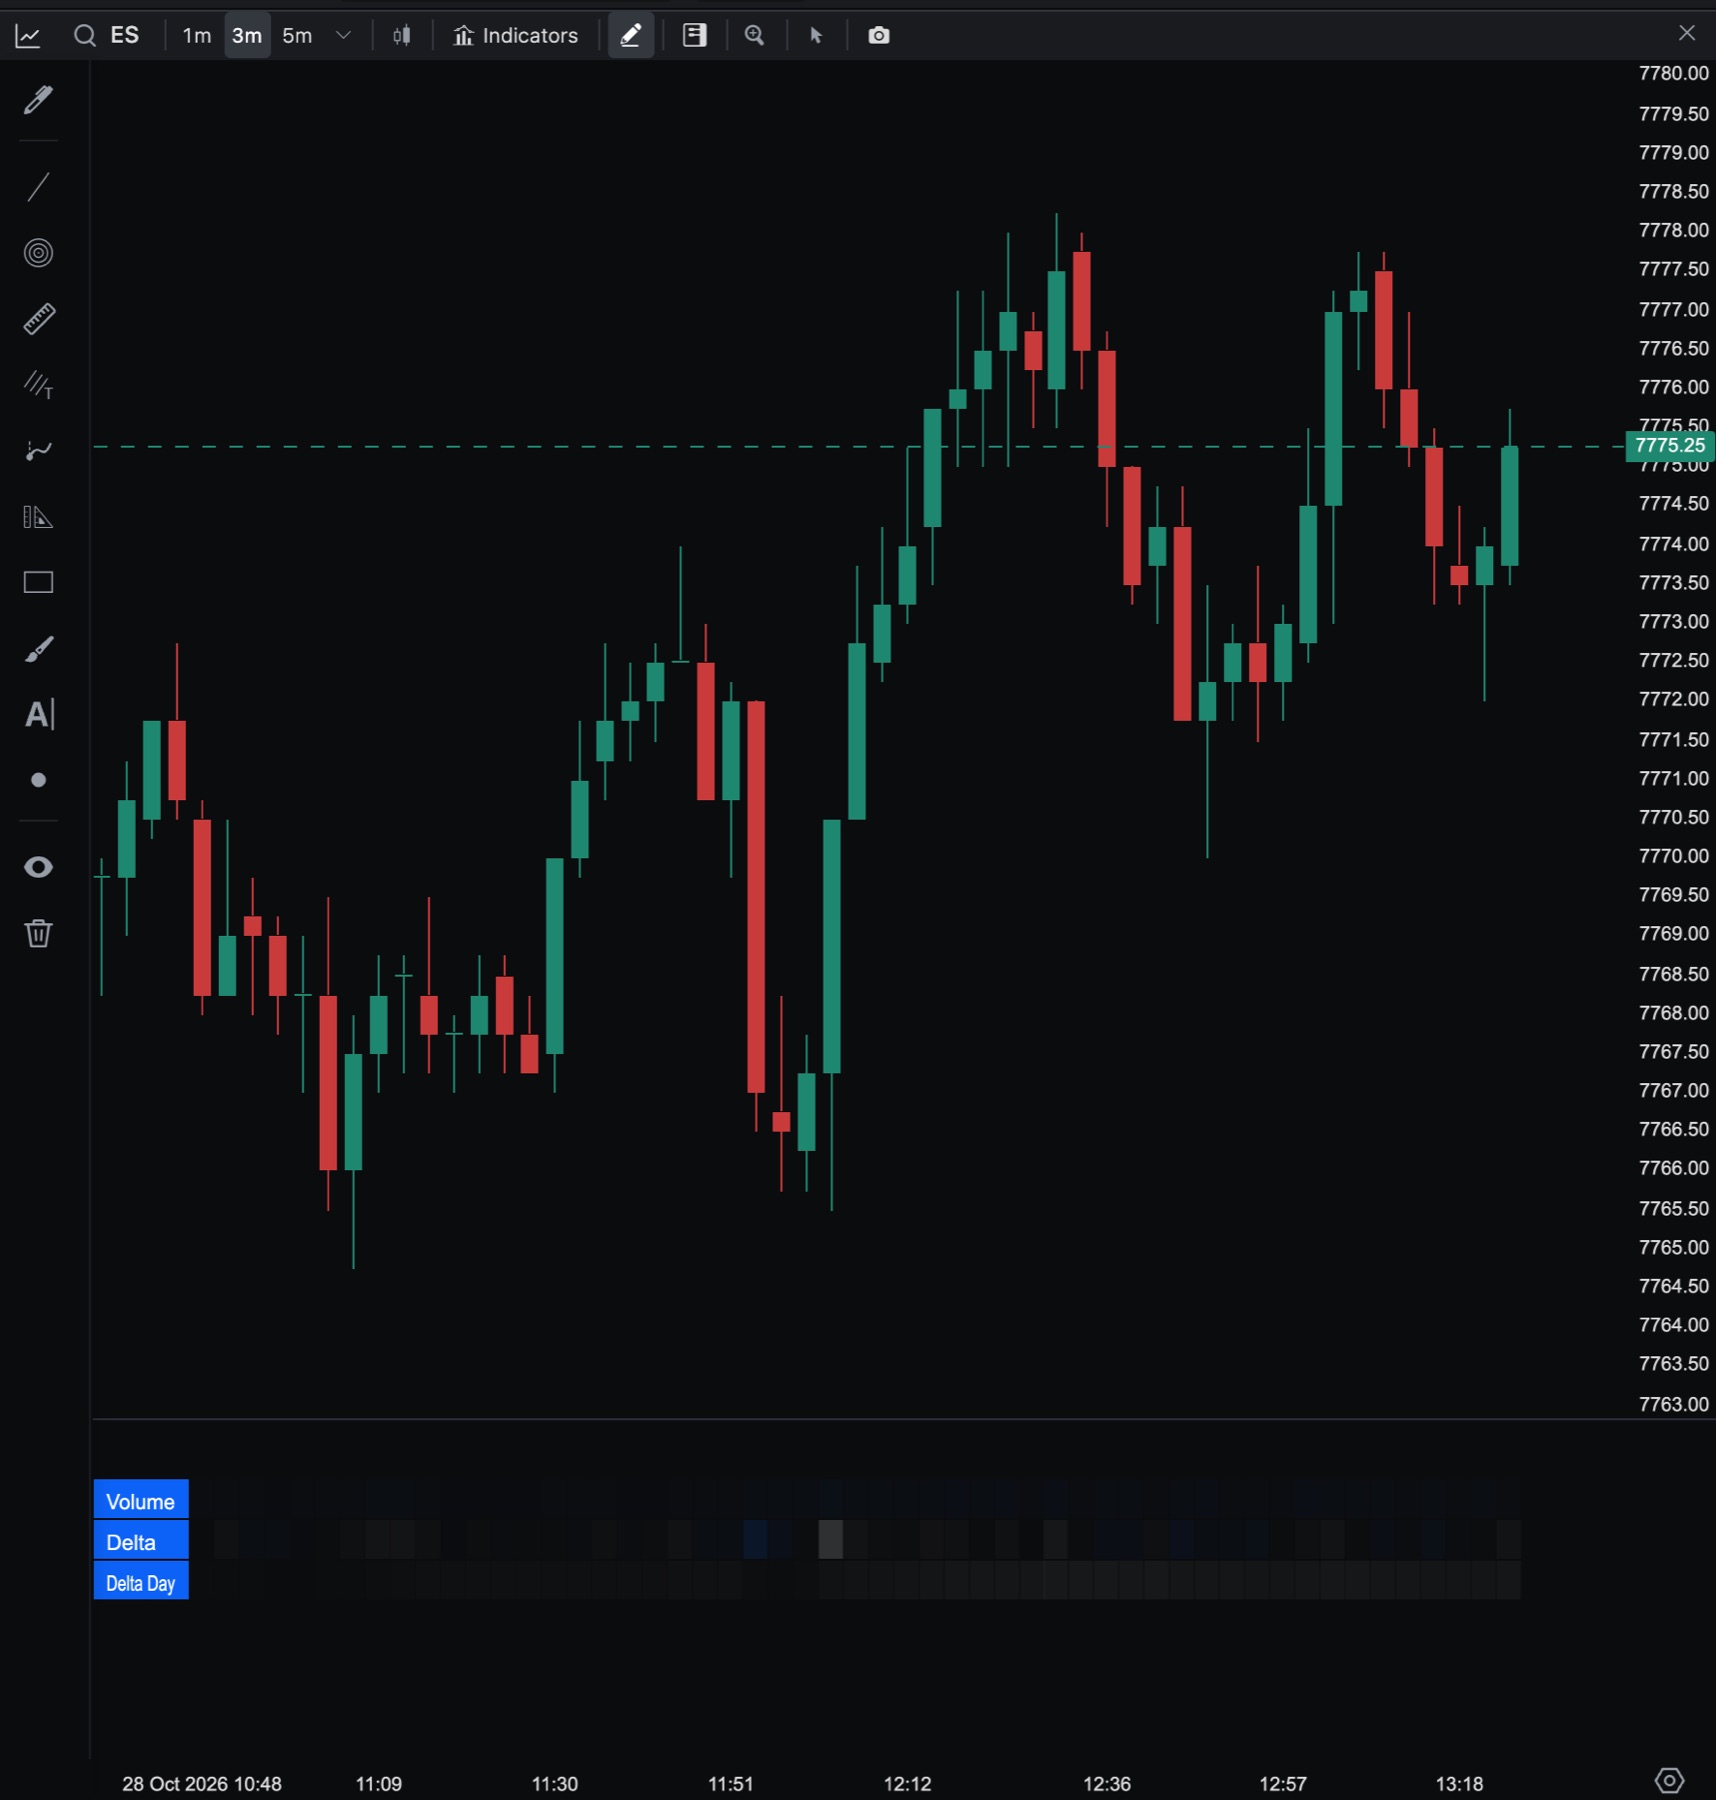
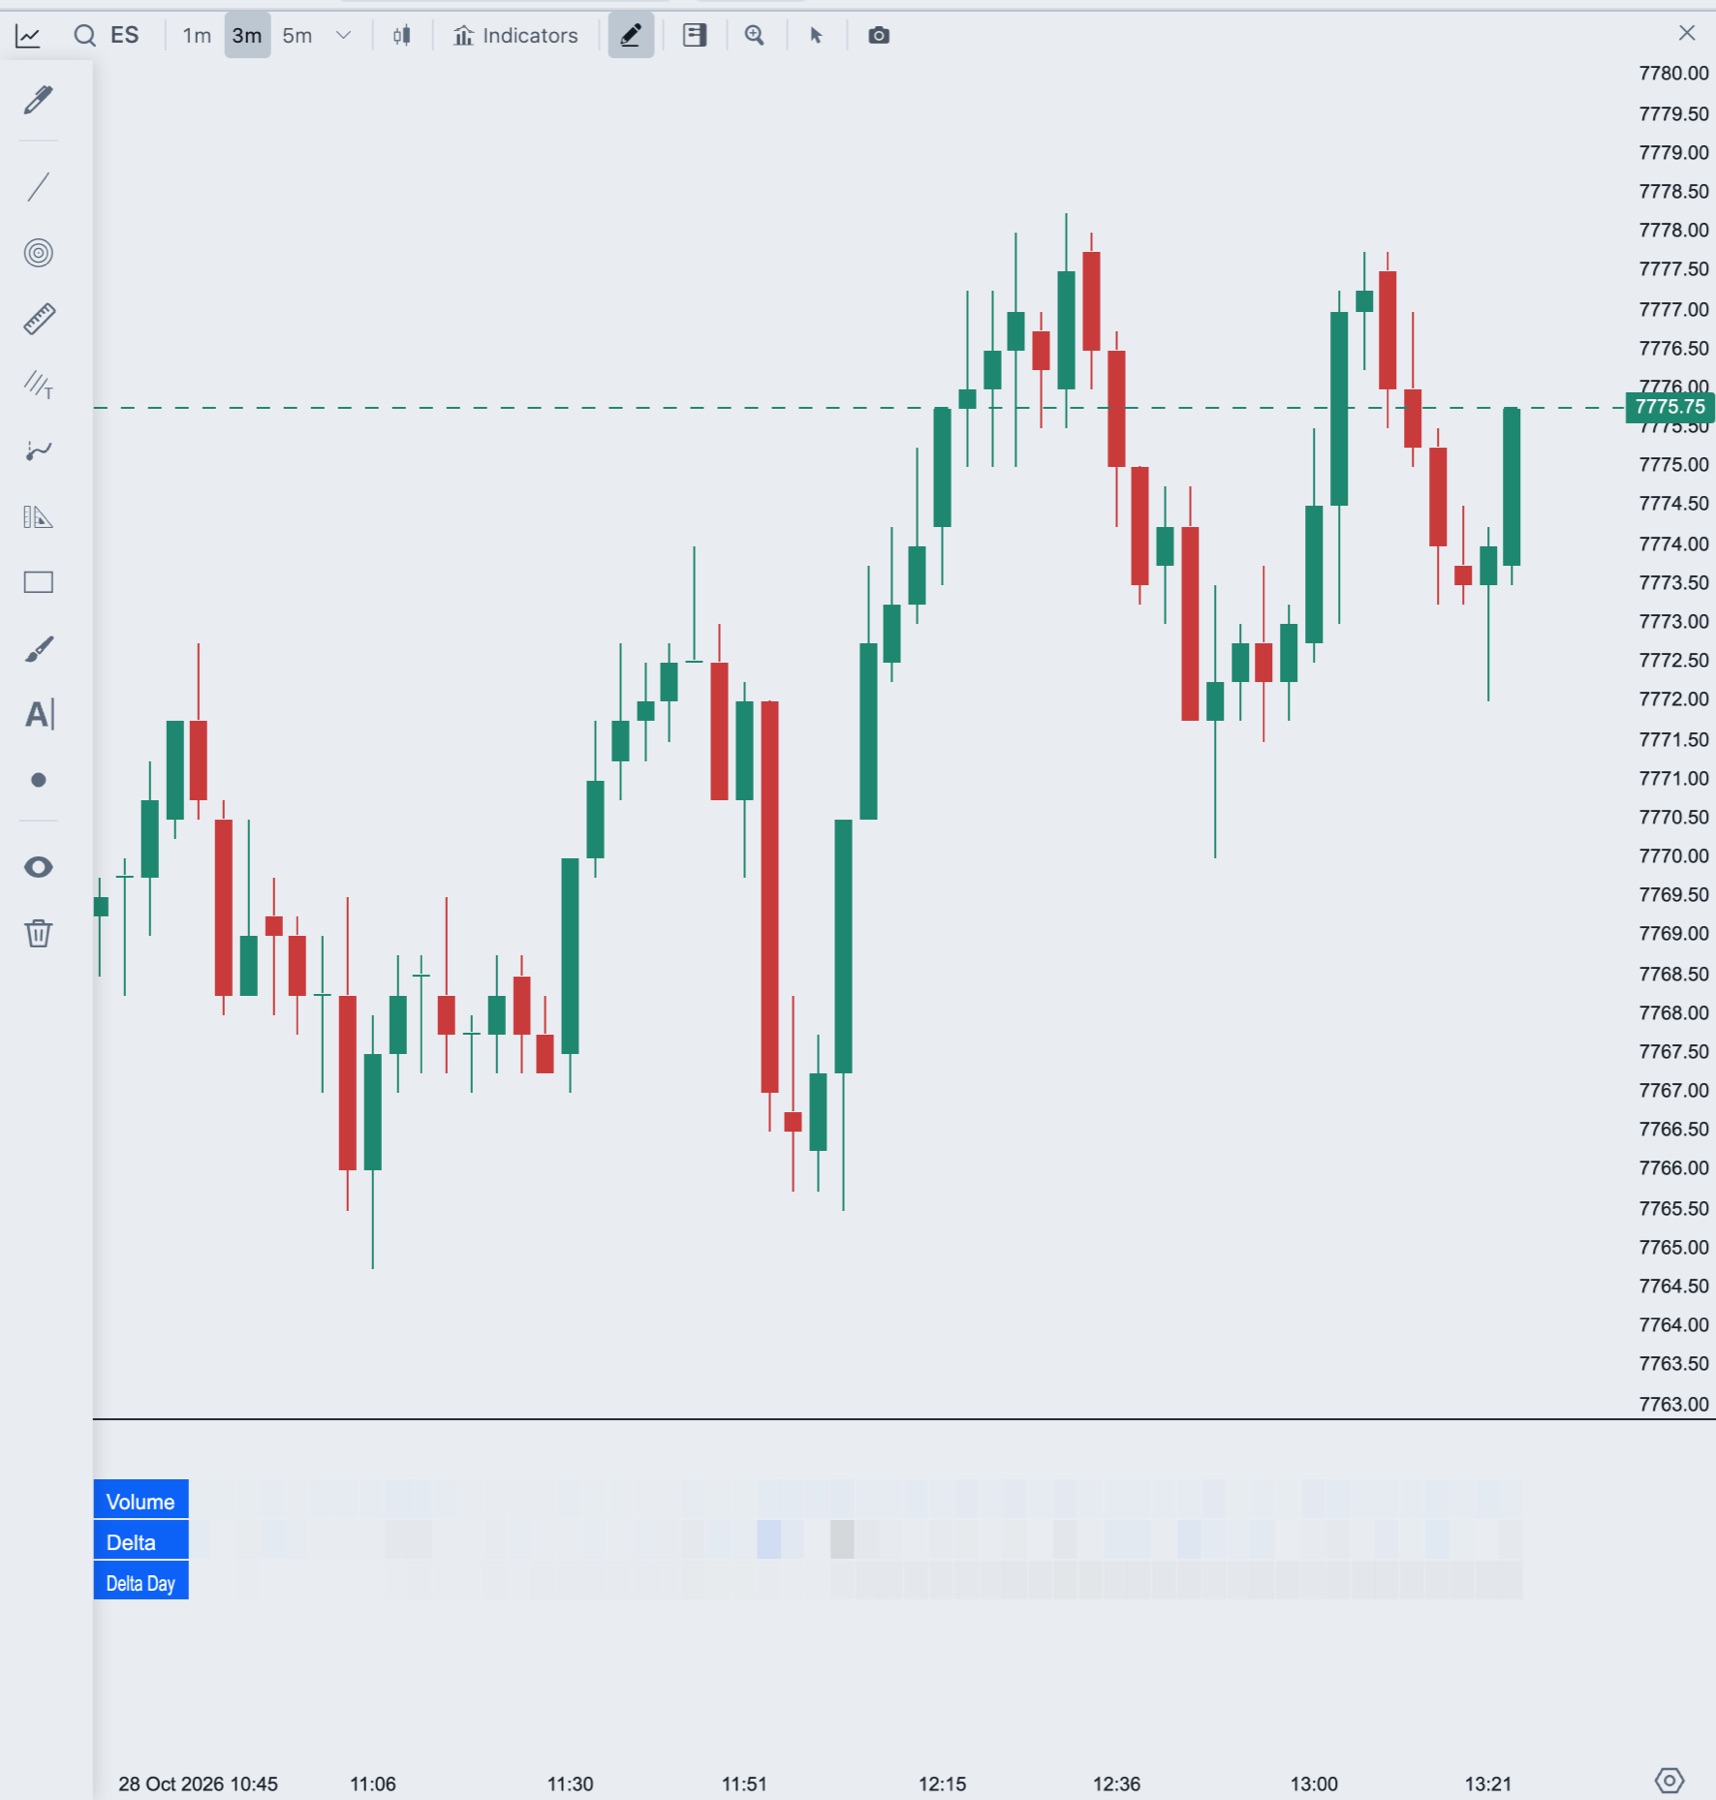
Add Bar Stats to a chart
- In the chart header, click Indicators.
- Type
statsin Search indicators and click BarStats. - Under Groups rows, tick the rows you want and drag them into the order you prefer.
Bar Stats allows one copy per chart. It opens in its own panel.
Settings
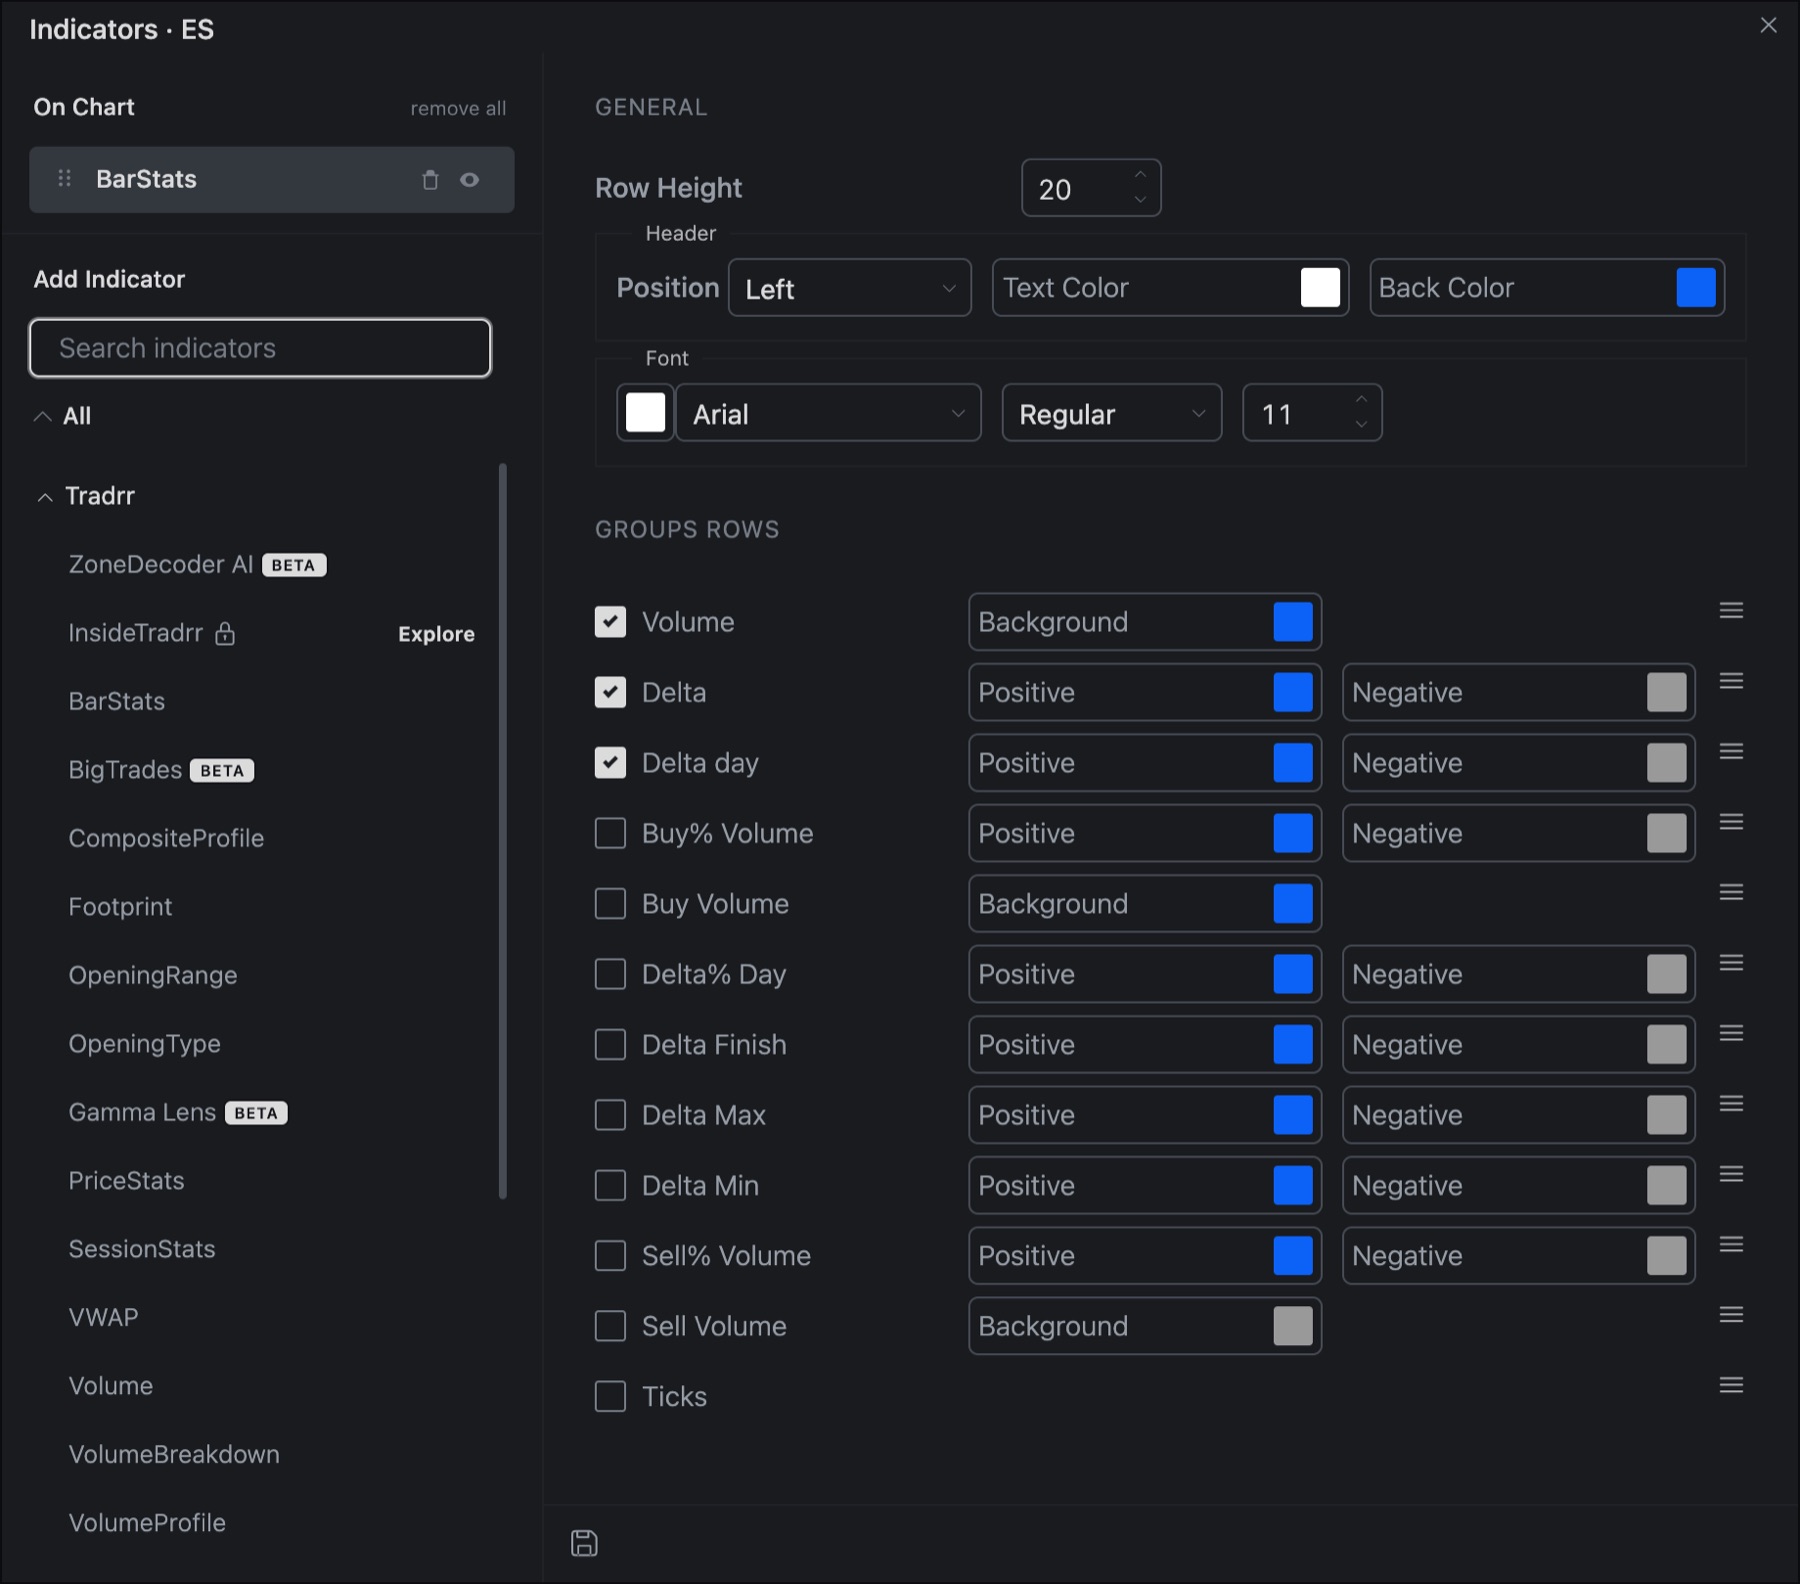
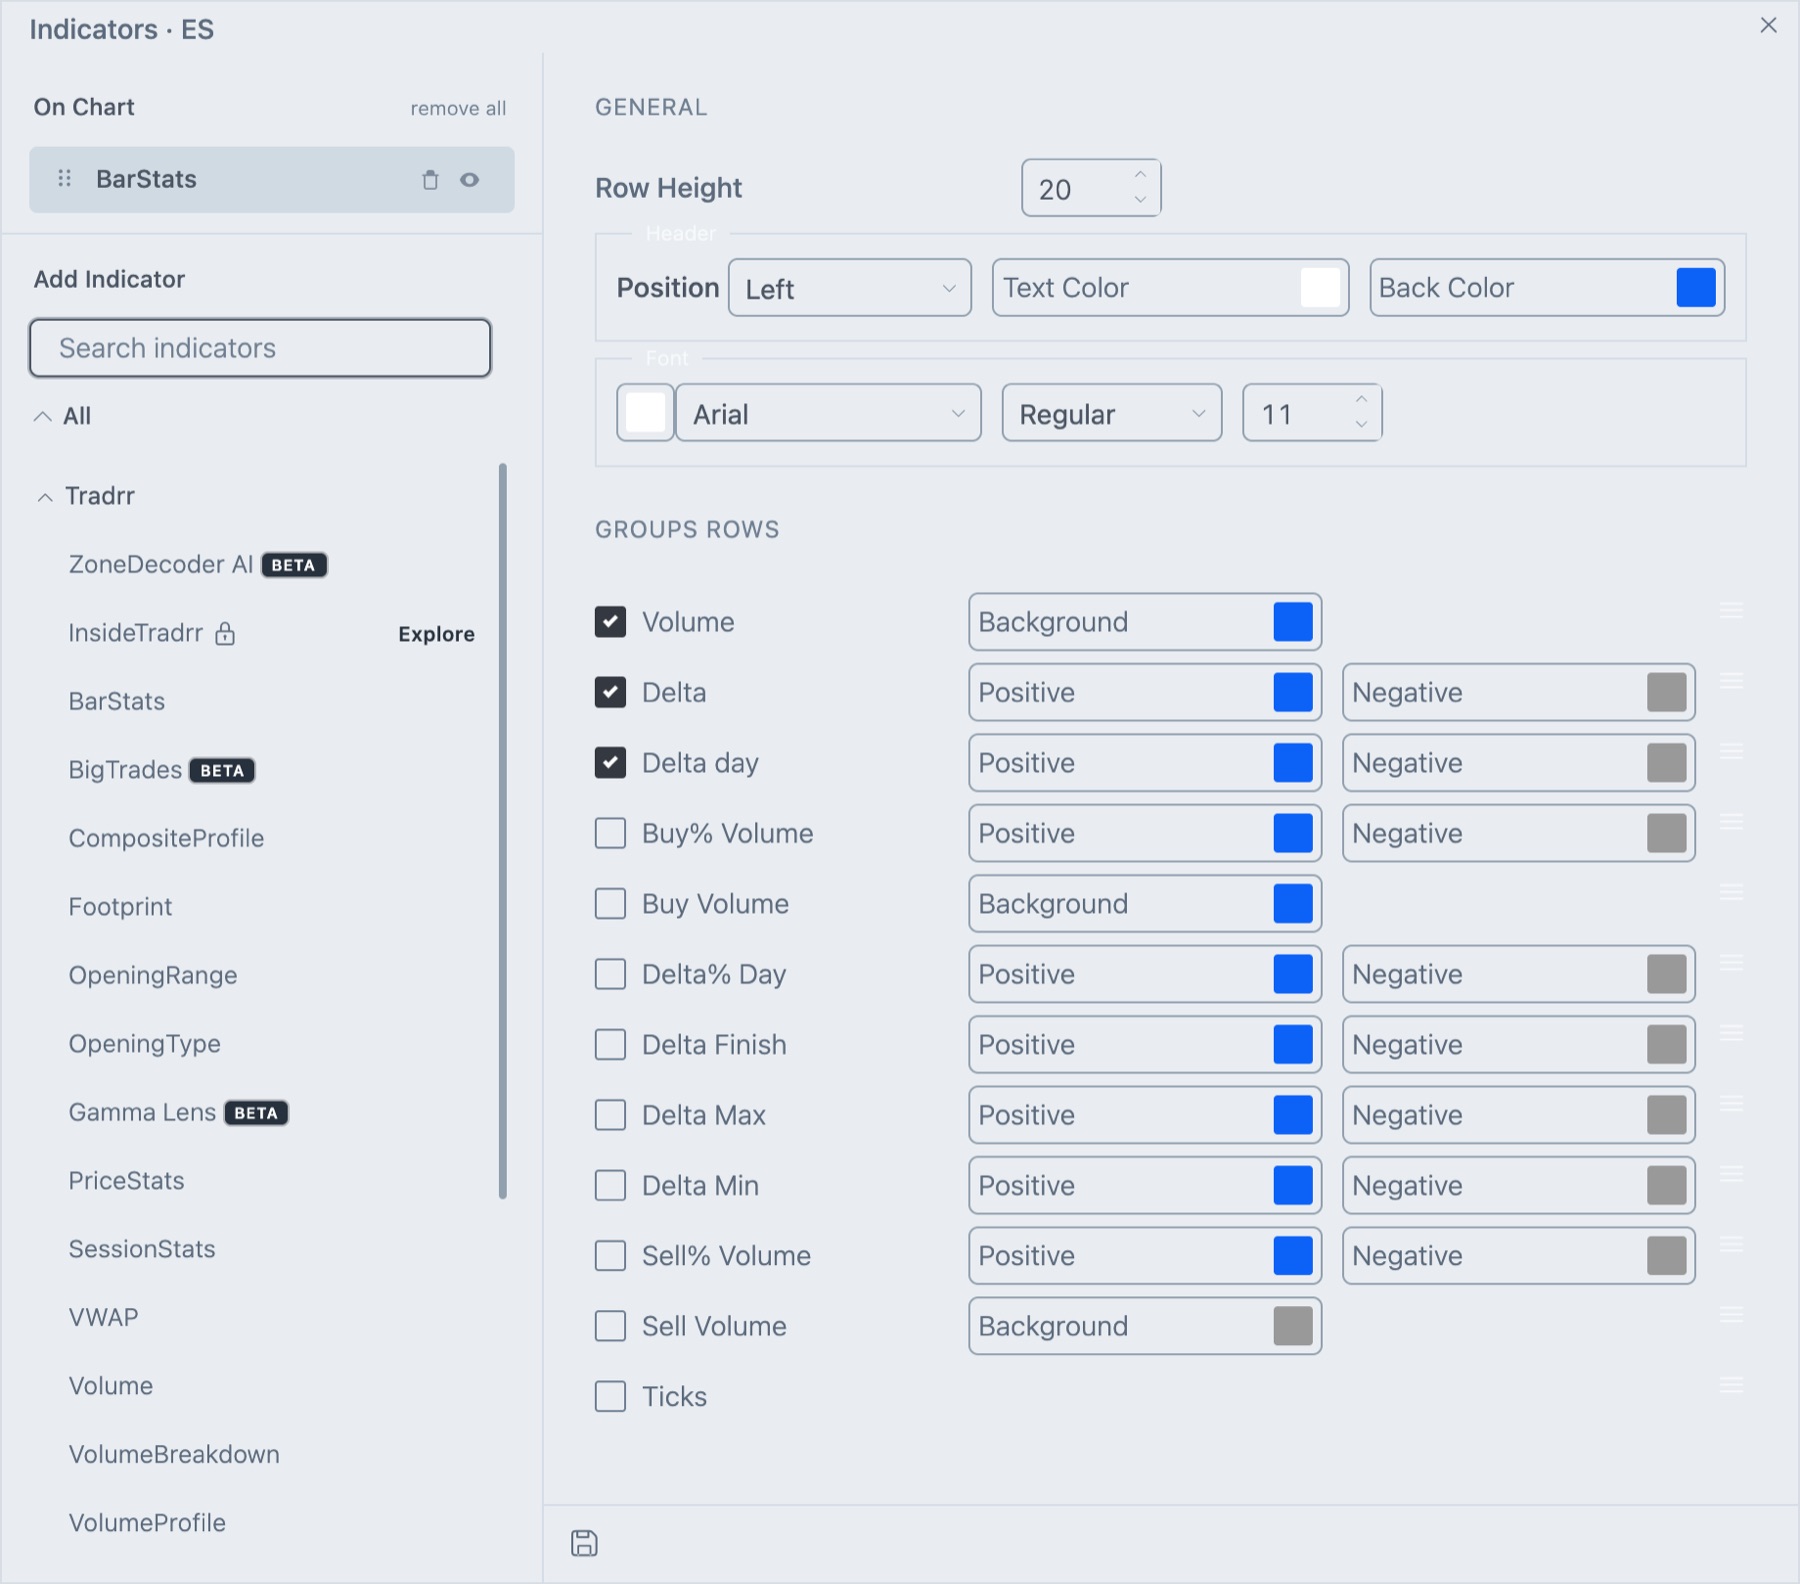
General
| Setting | What it does | Default |
|---|---|---|
| Row Height | Height of each row in pixels. | 20 |
| Header: Position | Puts the row names on the Left or the Right. | Left |
| Header: Text Color, Back Color | Text and background colors of the row names. | |
| Font: color | The color box at the start of the Font row. It colors the figures. | |
| Font: family and style | Family Open Sans, Monospace, Sans Serif or Arial. Style Regular or Bold. | Arial, Regular |
| Font: size | Size of the figures. | 11 |
Groups rows
Each row has a tick box to show it. Drag rows up or down to reorder them. The rows are Delta, Volume, Delta day, Buy Volume, Sell Volume, Delta% Day, Buy% Volume, Sell% Volume, Delta Max, Delta Min, Delta Finish and Ticks.
| Setting | What it does | Default |
|---|---|---|
| Row tick box | Shows or hides that row. | On for Volume, Delta and Delta day. Off for the rest |
| Background | Cell background color. Rows for Volume, Buy Volume and Sell Volume have this. | |
| Positive, Negative | Colors for positive and negative figures. The delta and percentage rows have these. |
The Ticks row has no color settings.
How traders read it
- Delta against the candle: an up candle with negative delta shows the move was not driven by aggressive buyers.
- Delta day: a running total that shows which side has been more aggressive across the session.
- Delta Max and Delta Min: large values show one price where one side was very active inside the bar.
- Ticks: many prices traded in a bar means a wide, active range. Few means a narrow bar.
Tip. Keep three or four rows. A tall table takes space from the price chart, and the Row Height setting changes how much it uses.
Related articles
Was this article helpful?