Volume
Volume shows how many contracts traded in each bar. It is drawn as a column per bar in its own panel below the price chart.
- Shows
- One column per bar, as tall as the bar's volume
- Updates
- Live, as trades arrive in the current bar
- Best on
- Any chart interval
What it measures
Each column is the total volume of one bar: every contract traded between the bar's open and close time. A tall column means more trading in that bar than its neighbors. The panel scales itself as volume changes.
Volume does not split buying from selling. For that, see Volume Breakdown.
On the chart
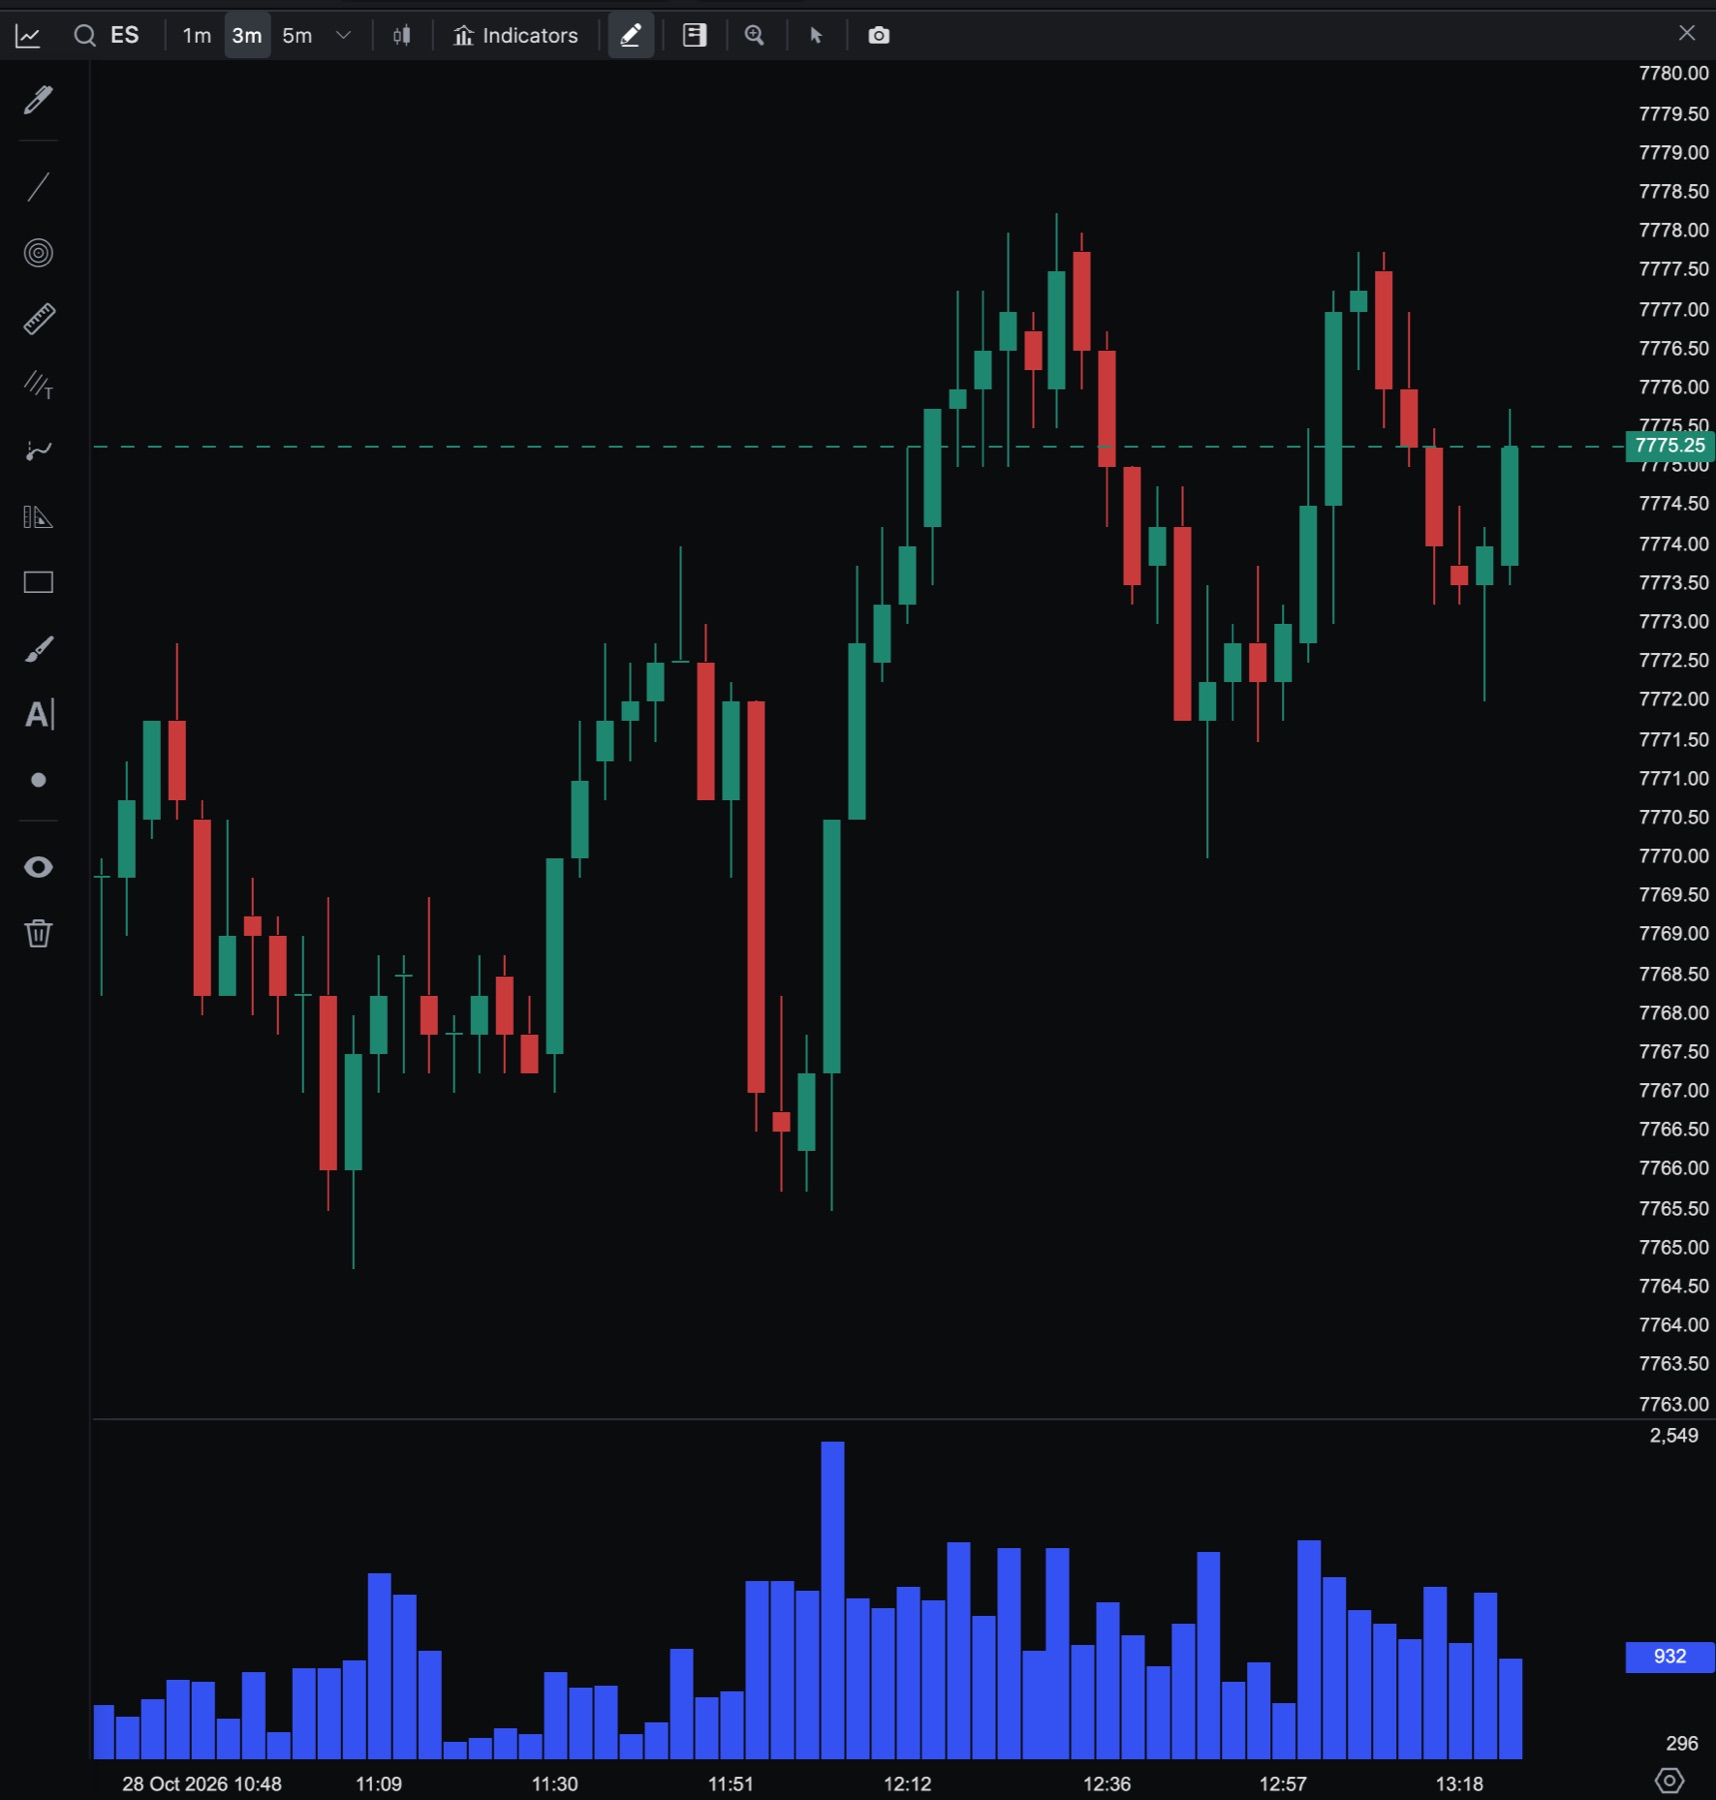
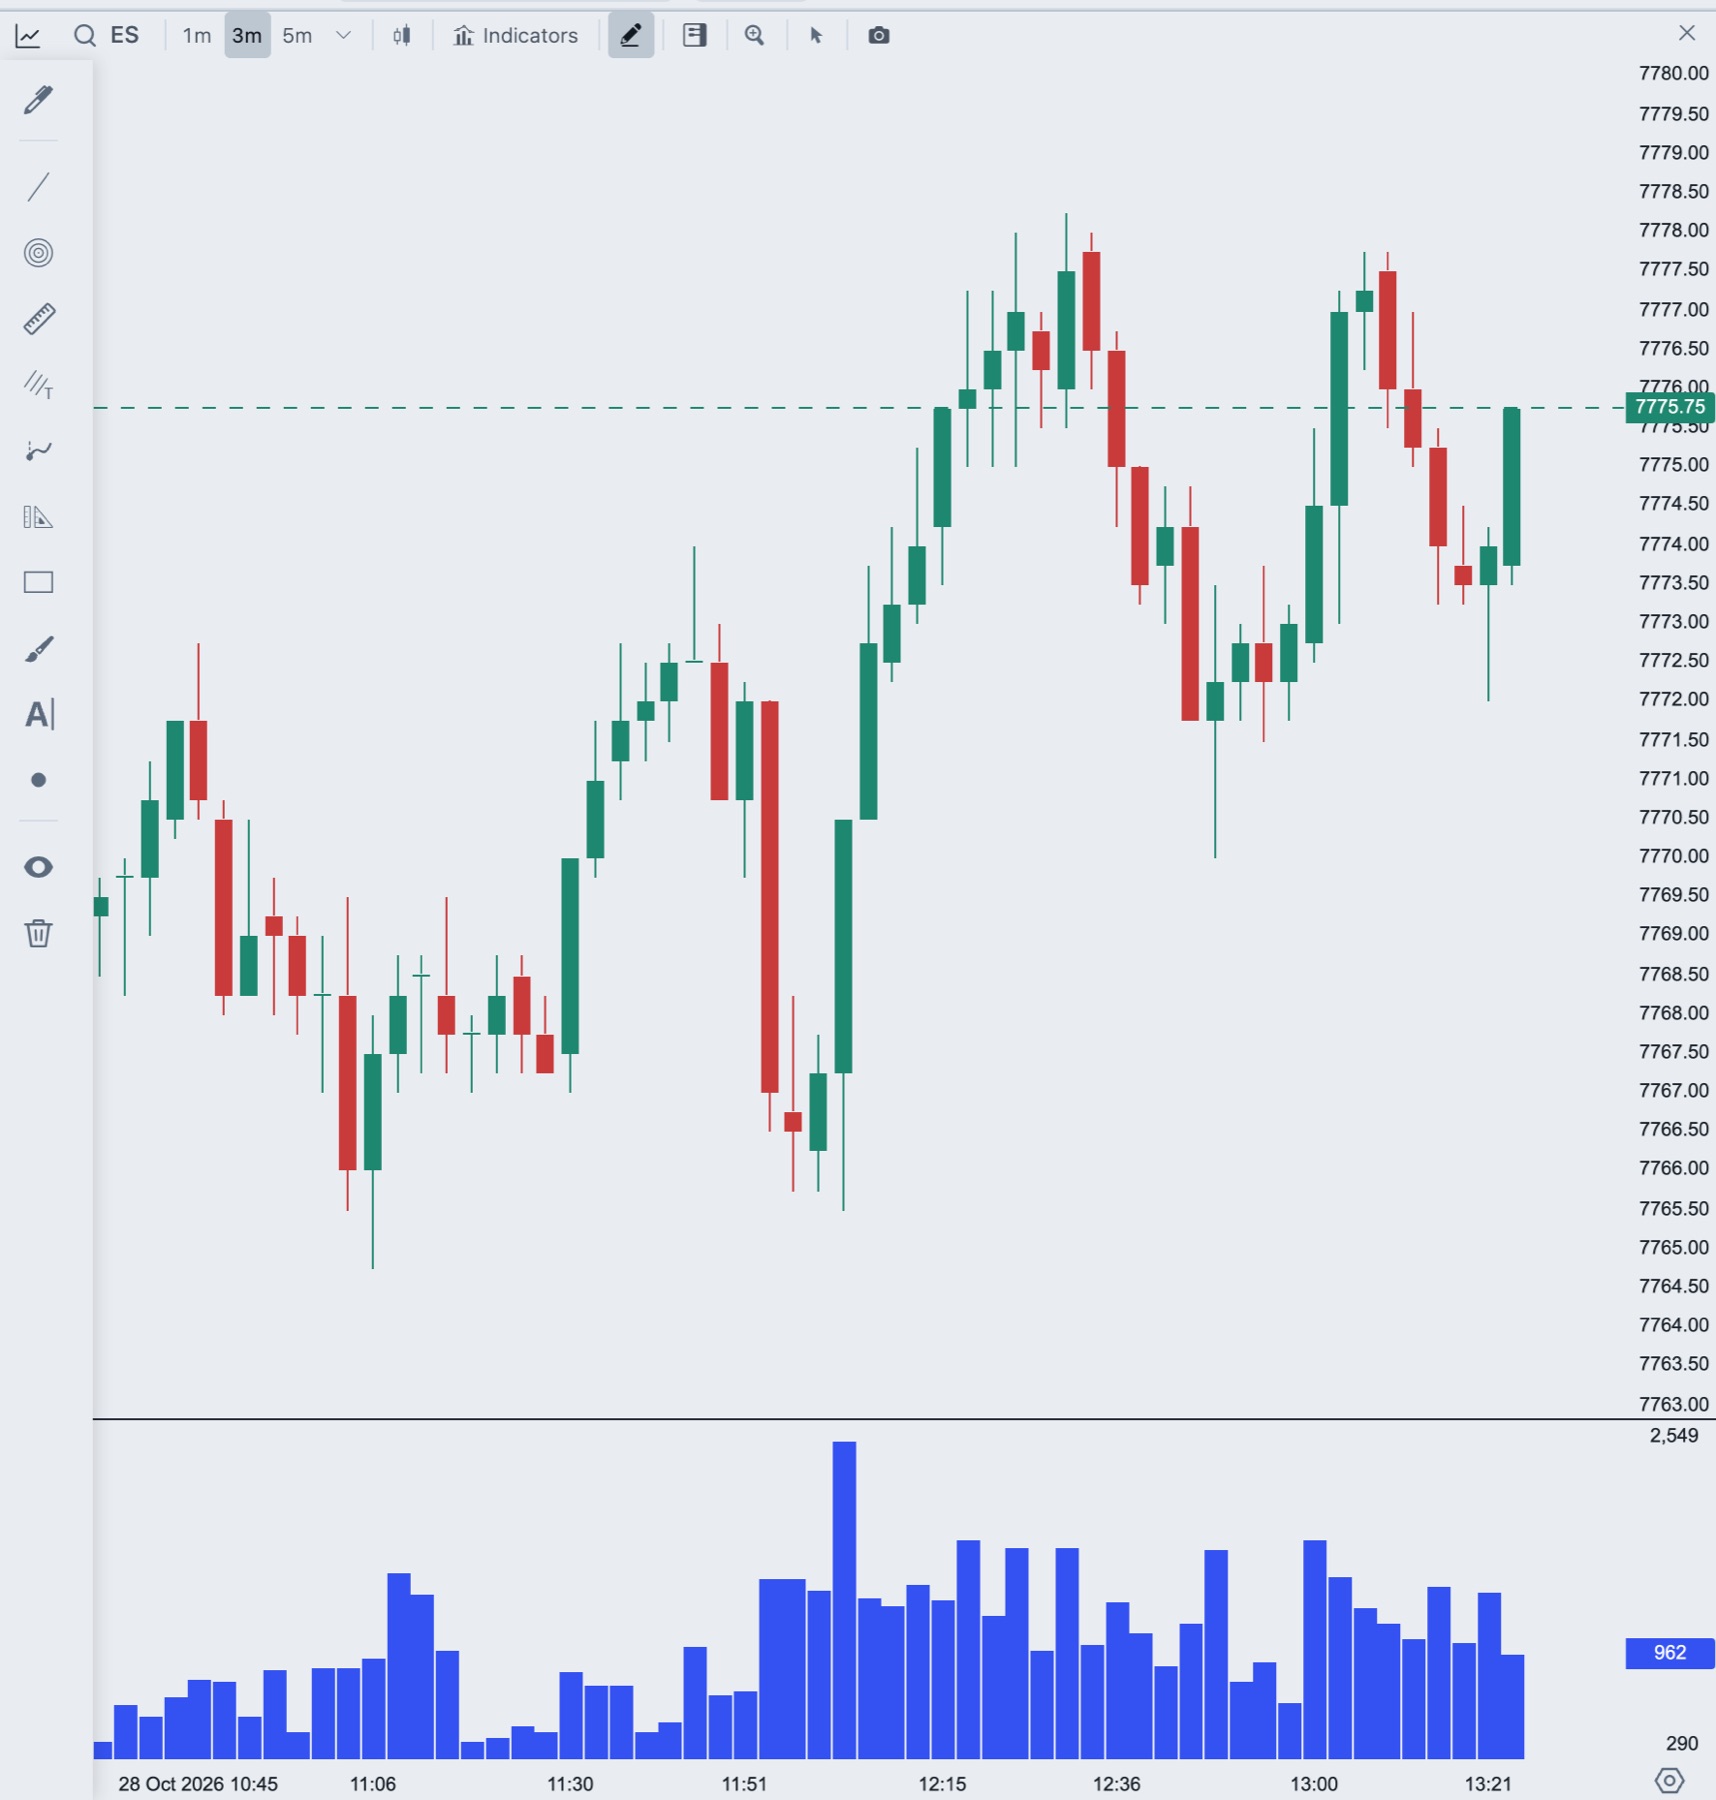
Add Volume to a chart
- In the chart header, click Indicators.
- Click Volume in the Tradrr group.
- Change the color on the right if you want.
Volume allows one copy per chart. To remove it, click the bin icon beside it in On Chart. For the Indicators window in general, see Add and manage indicators.
Settings
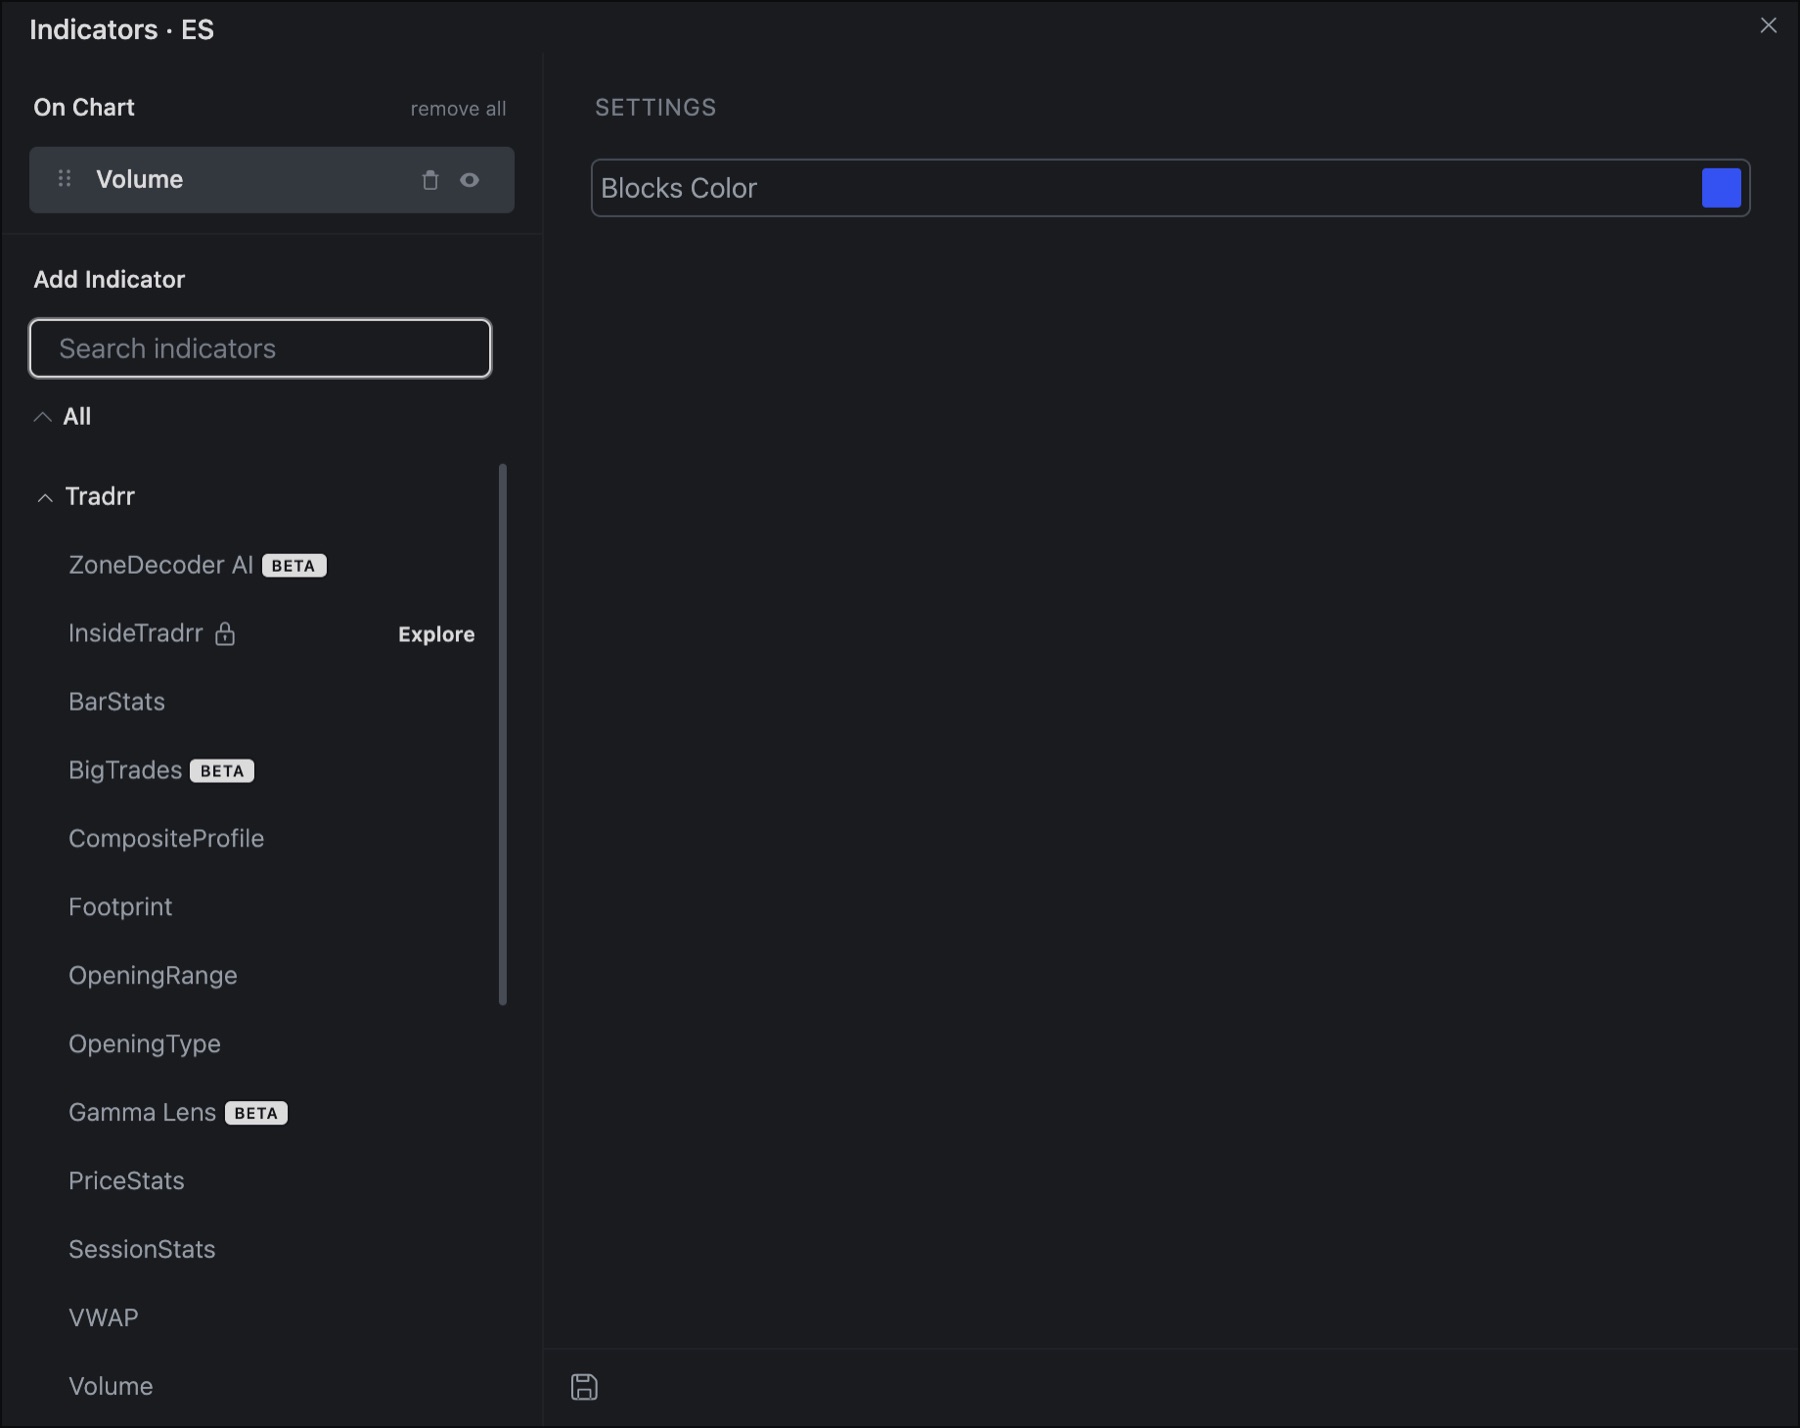
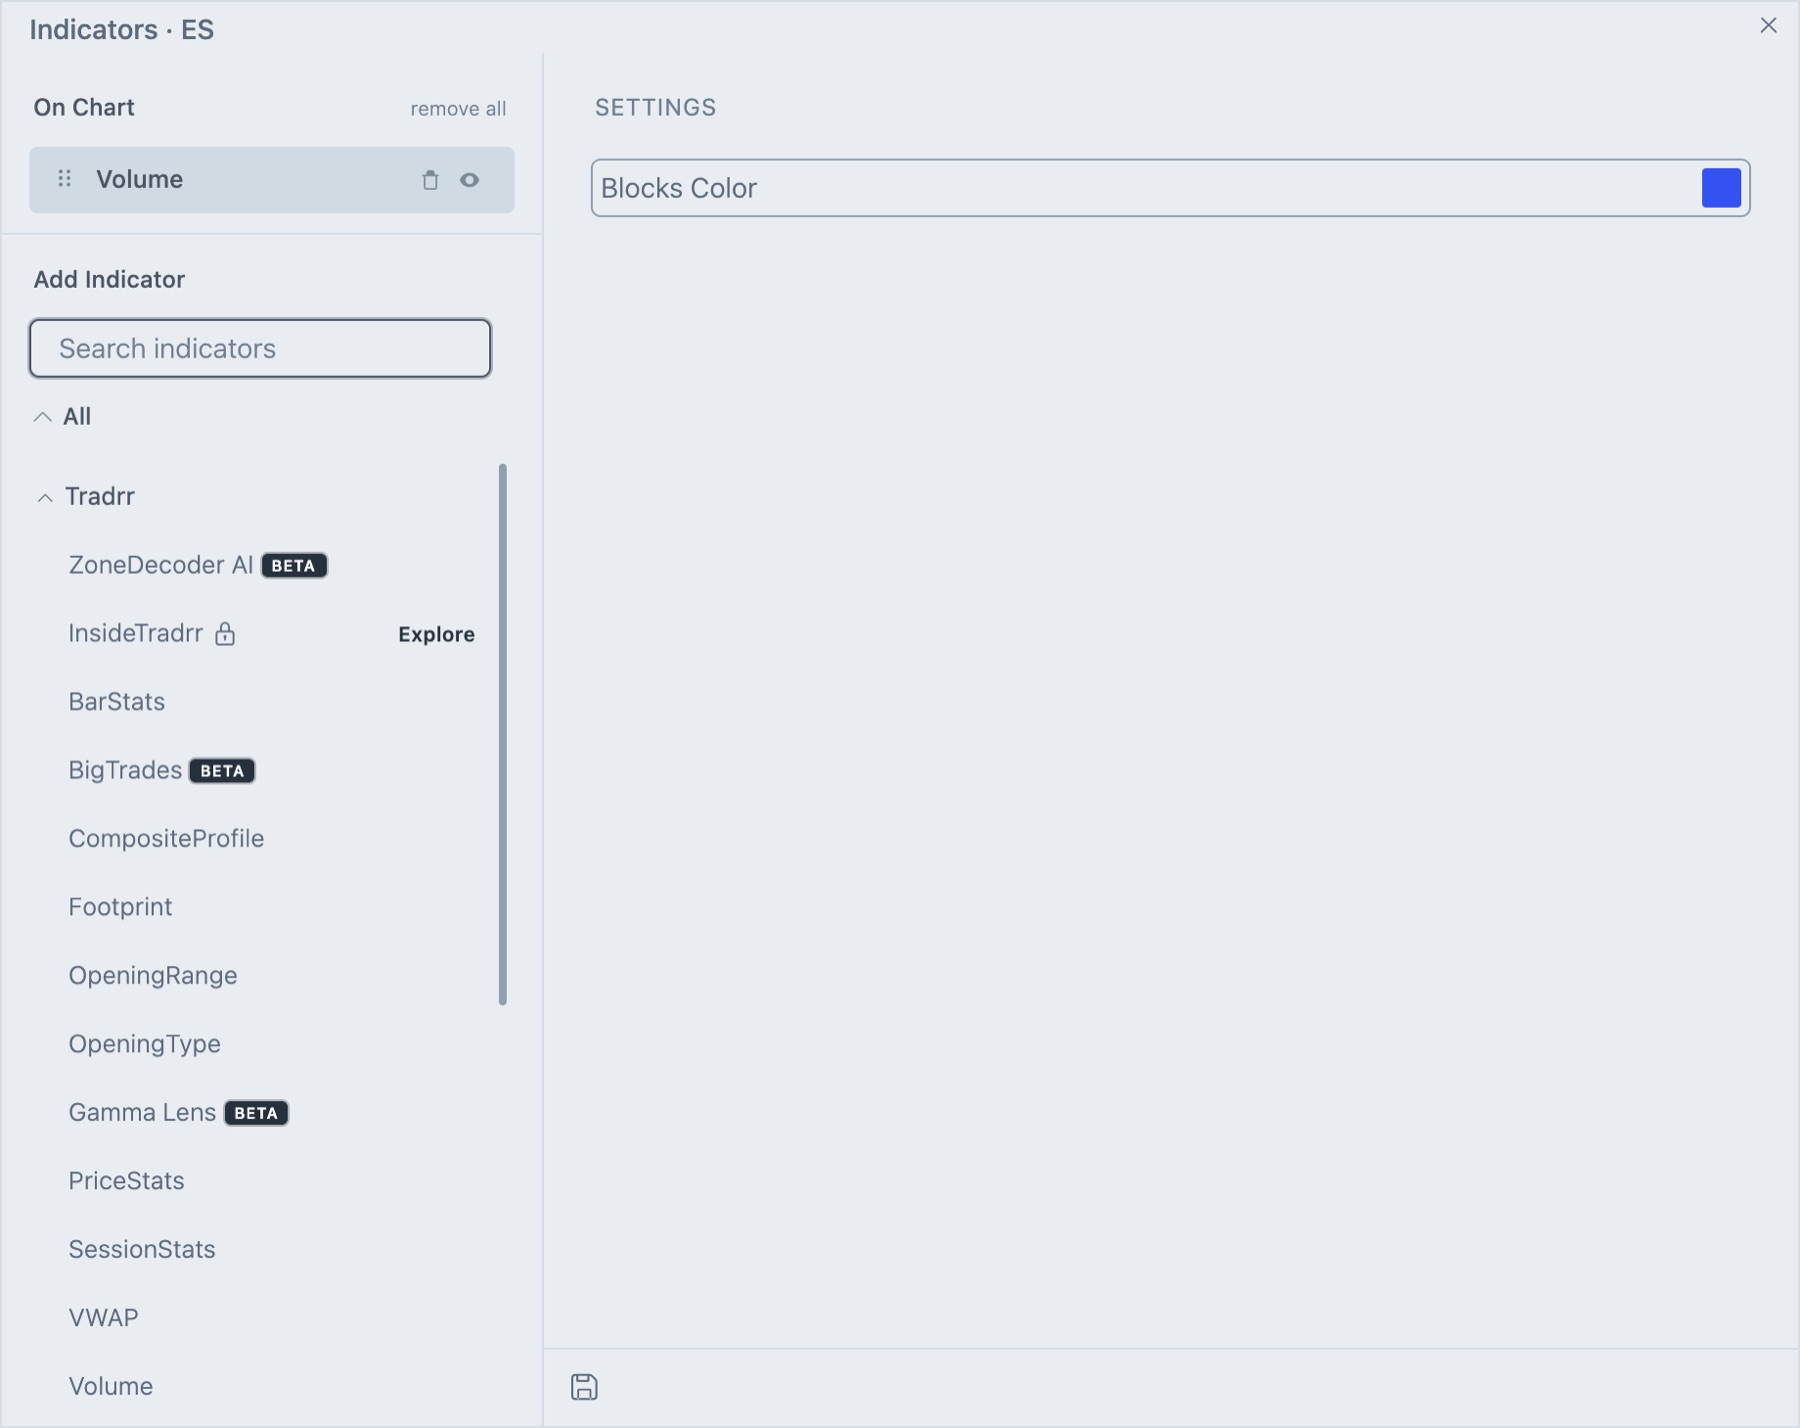
| Setting | What it does | Default |
|---|---|---|
| Blocks Color | The color of the volume columns. | Blue (#3452F1) |
How traders read it
- Volume with a move: a breakout on rising volume has more trading behind it than one on falling volume.
- Spikes: a column far taller than its neighbors marks a burst of activity, often at news or the open.
- Quiet bars: low volume means few traders took part, so a move on it is easier to reverse.
Tip. Compare columns only on the same interval. A 5-minute bar holds more volume than a 1-minute bar.
Related articles
Was this article helpful?