Composite Profile
Composite Profile merges the volume of the bars on your chart into one profile. Volume Profile draws a new profile for each day. Composite Profile gives you one profile for everything that's loaded, so you see where the market traded most.
- Shows
- One volume profile for the loaded bars, with POC and value area
- Updates
- As new volume trades and as more history loads
- Best on
- Time charts with several days loaded
What it measures
Composite Profile adds up the volume traded at each price across the loaded bars that fall inside the session you choose. Longer bars mean more volume at that price.
- POC (point of control) is the price with the most volume.
- Value area (VA) is the range around the POC that holds a set share of the volume. It starts at the POC and adds the next price above and below until it holds the share you set. The default is 70%.
The profile sits in a column at the edge of the chart, labelled Composite, and the chart leaves room for it beside the candles. You can drag the column header to reorder it or move it to the other edge, and use the arrow keys when the header has focus. Shift+Left or Shift+Right moves it to the other side, and Esc cancels.
On the chart
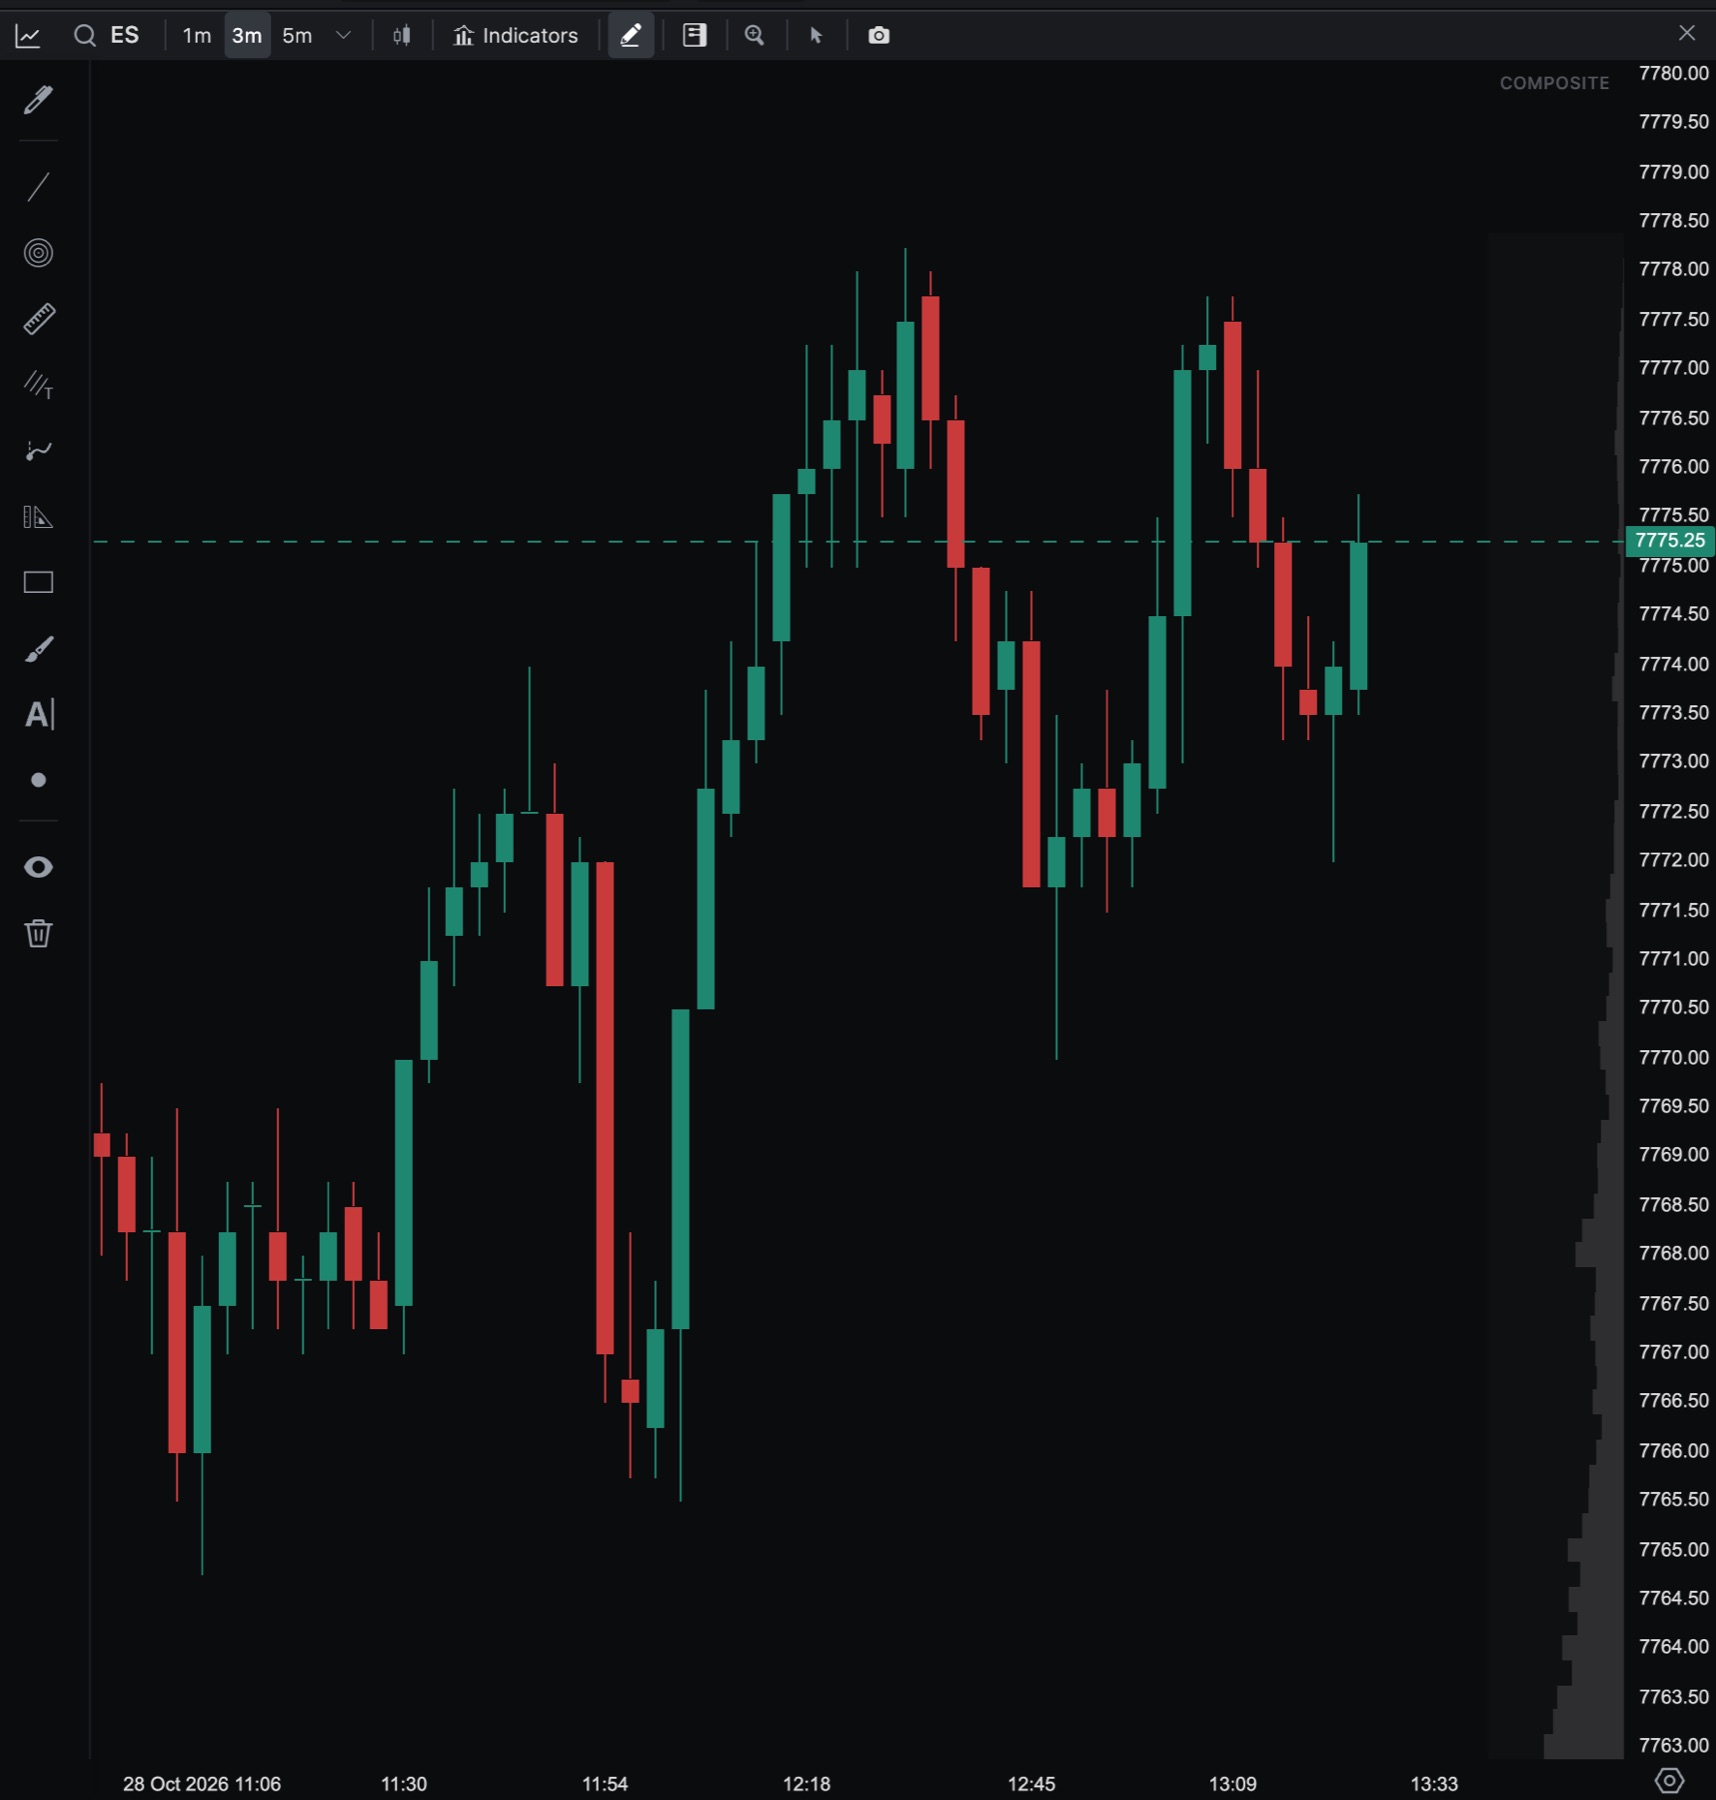
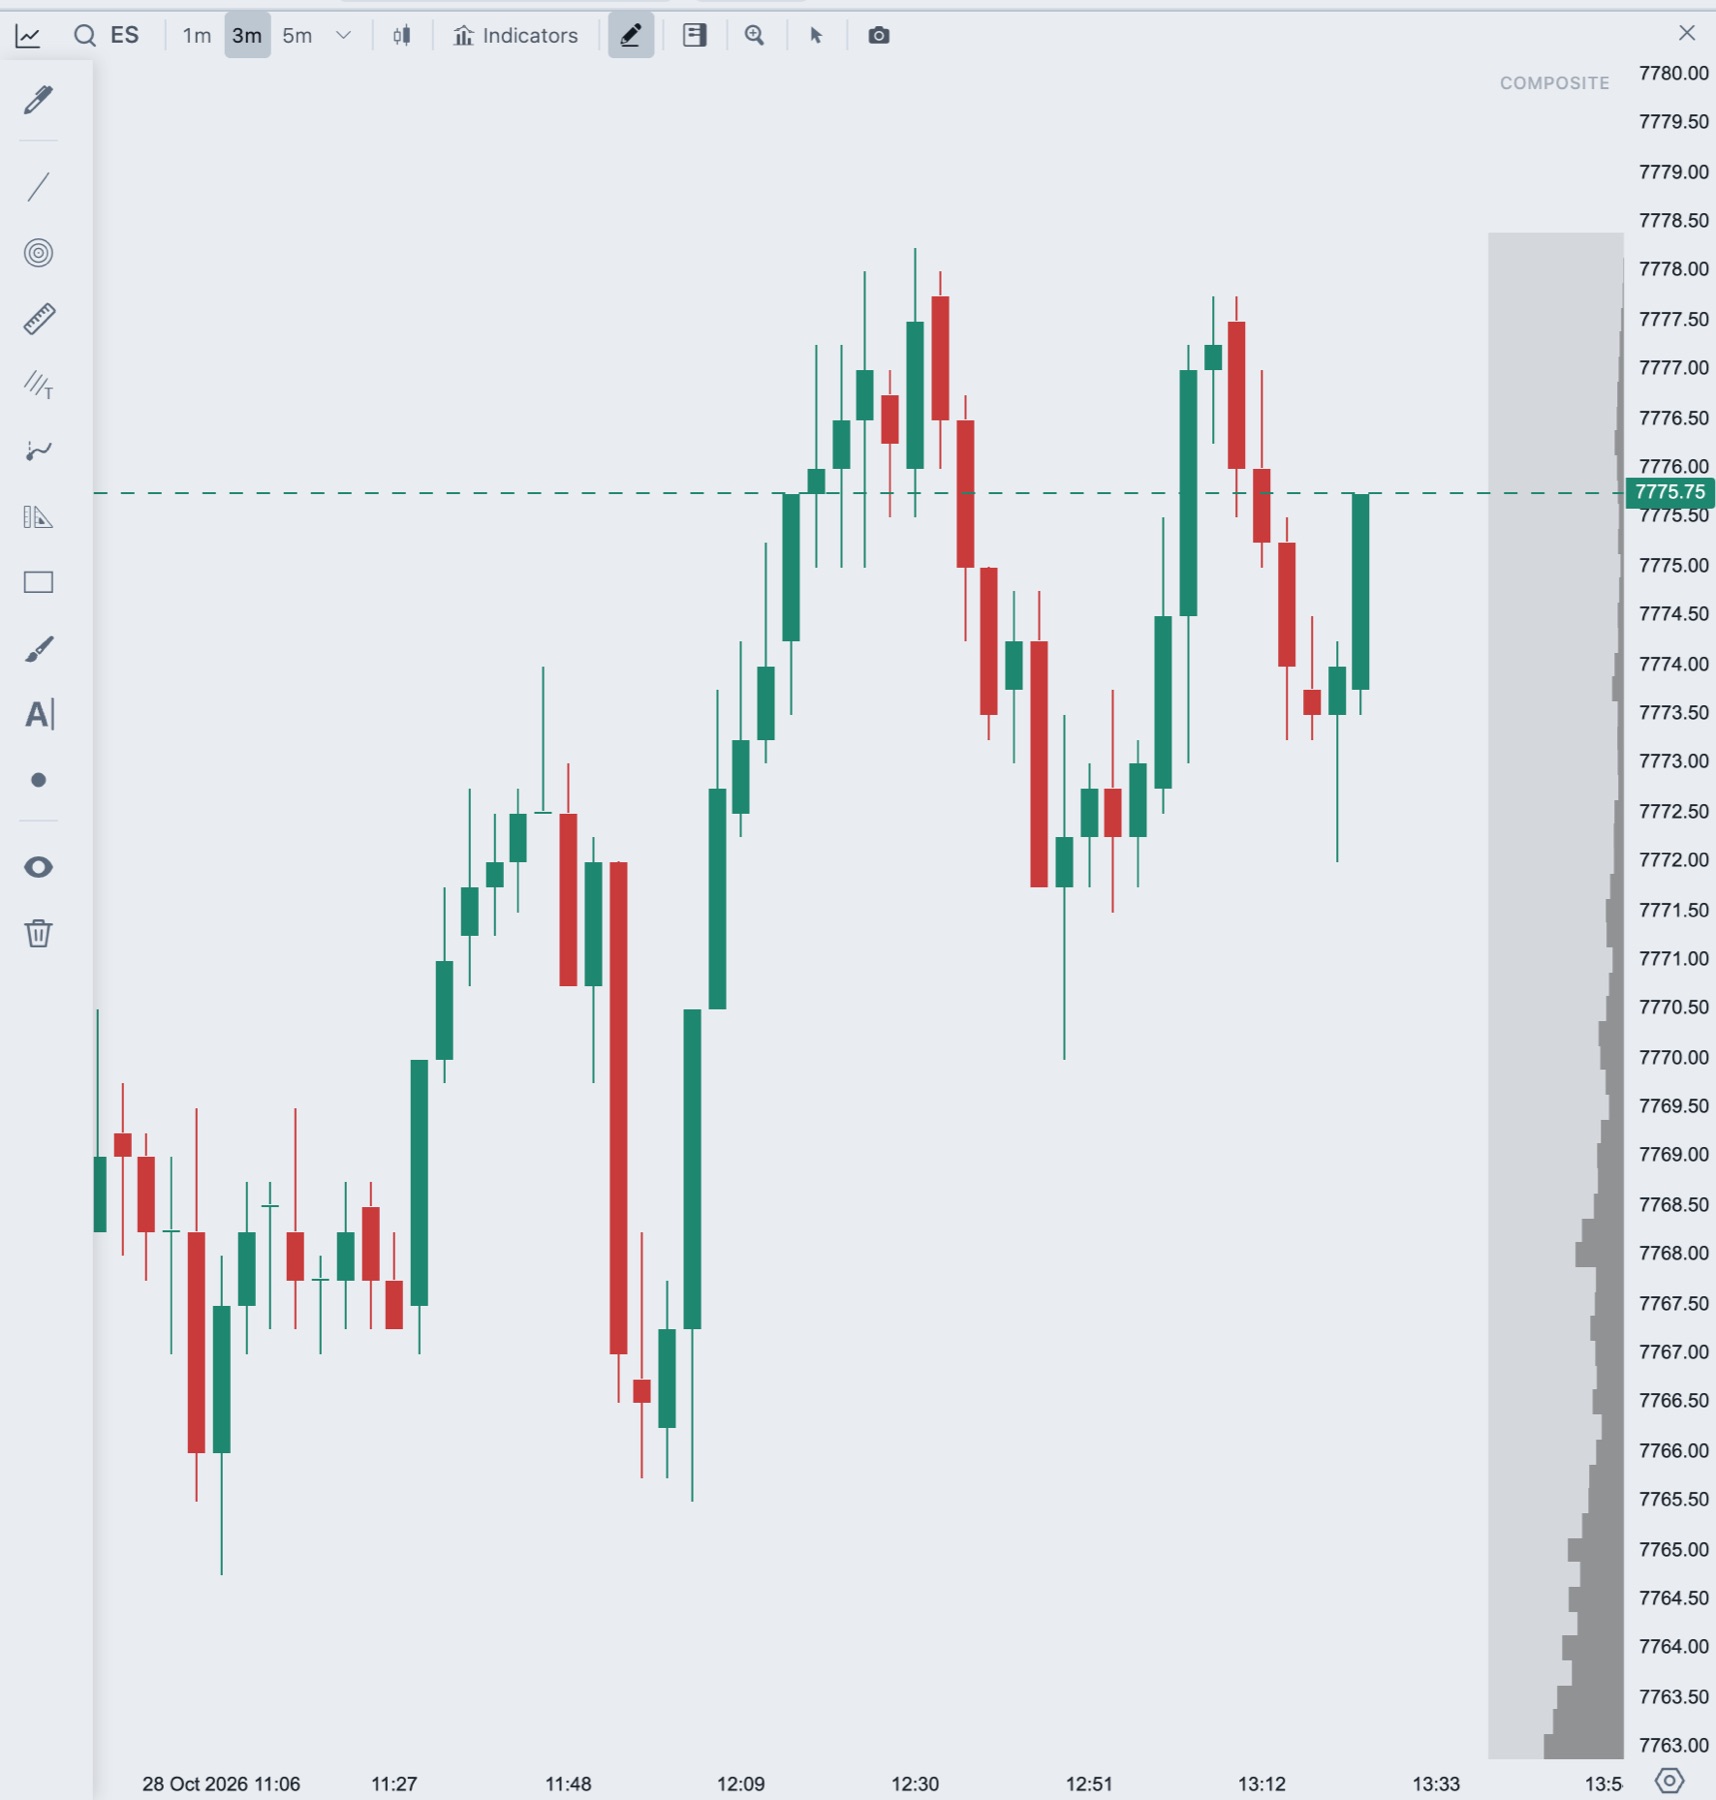
Add Composite Profile to a chart
- In the chart header, click Indicators.
- Click CompositeProfile in the Tradrr group.
- Change the settings on the right.
Composite Profile allows one copy per chart and is not available on tick charts. The profile covers the bars loaded on the chart. For a profile per day instead, use Volume Profile.
Settings
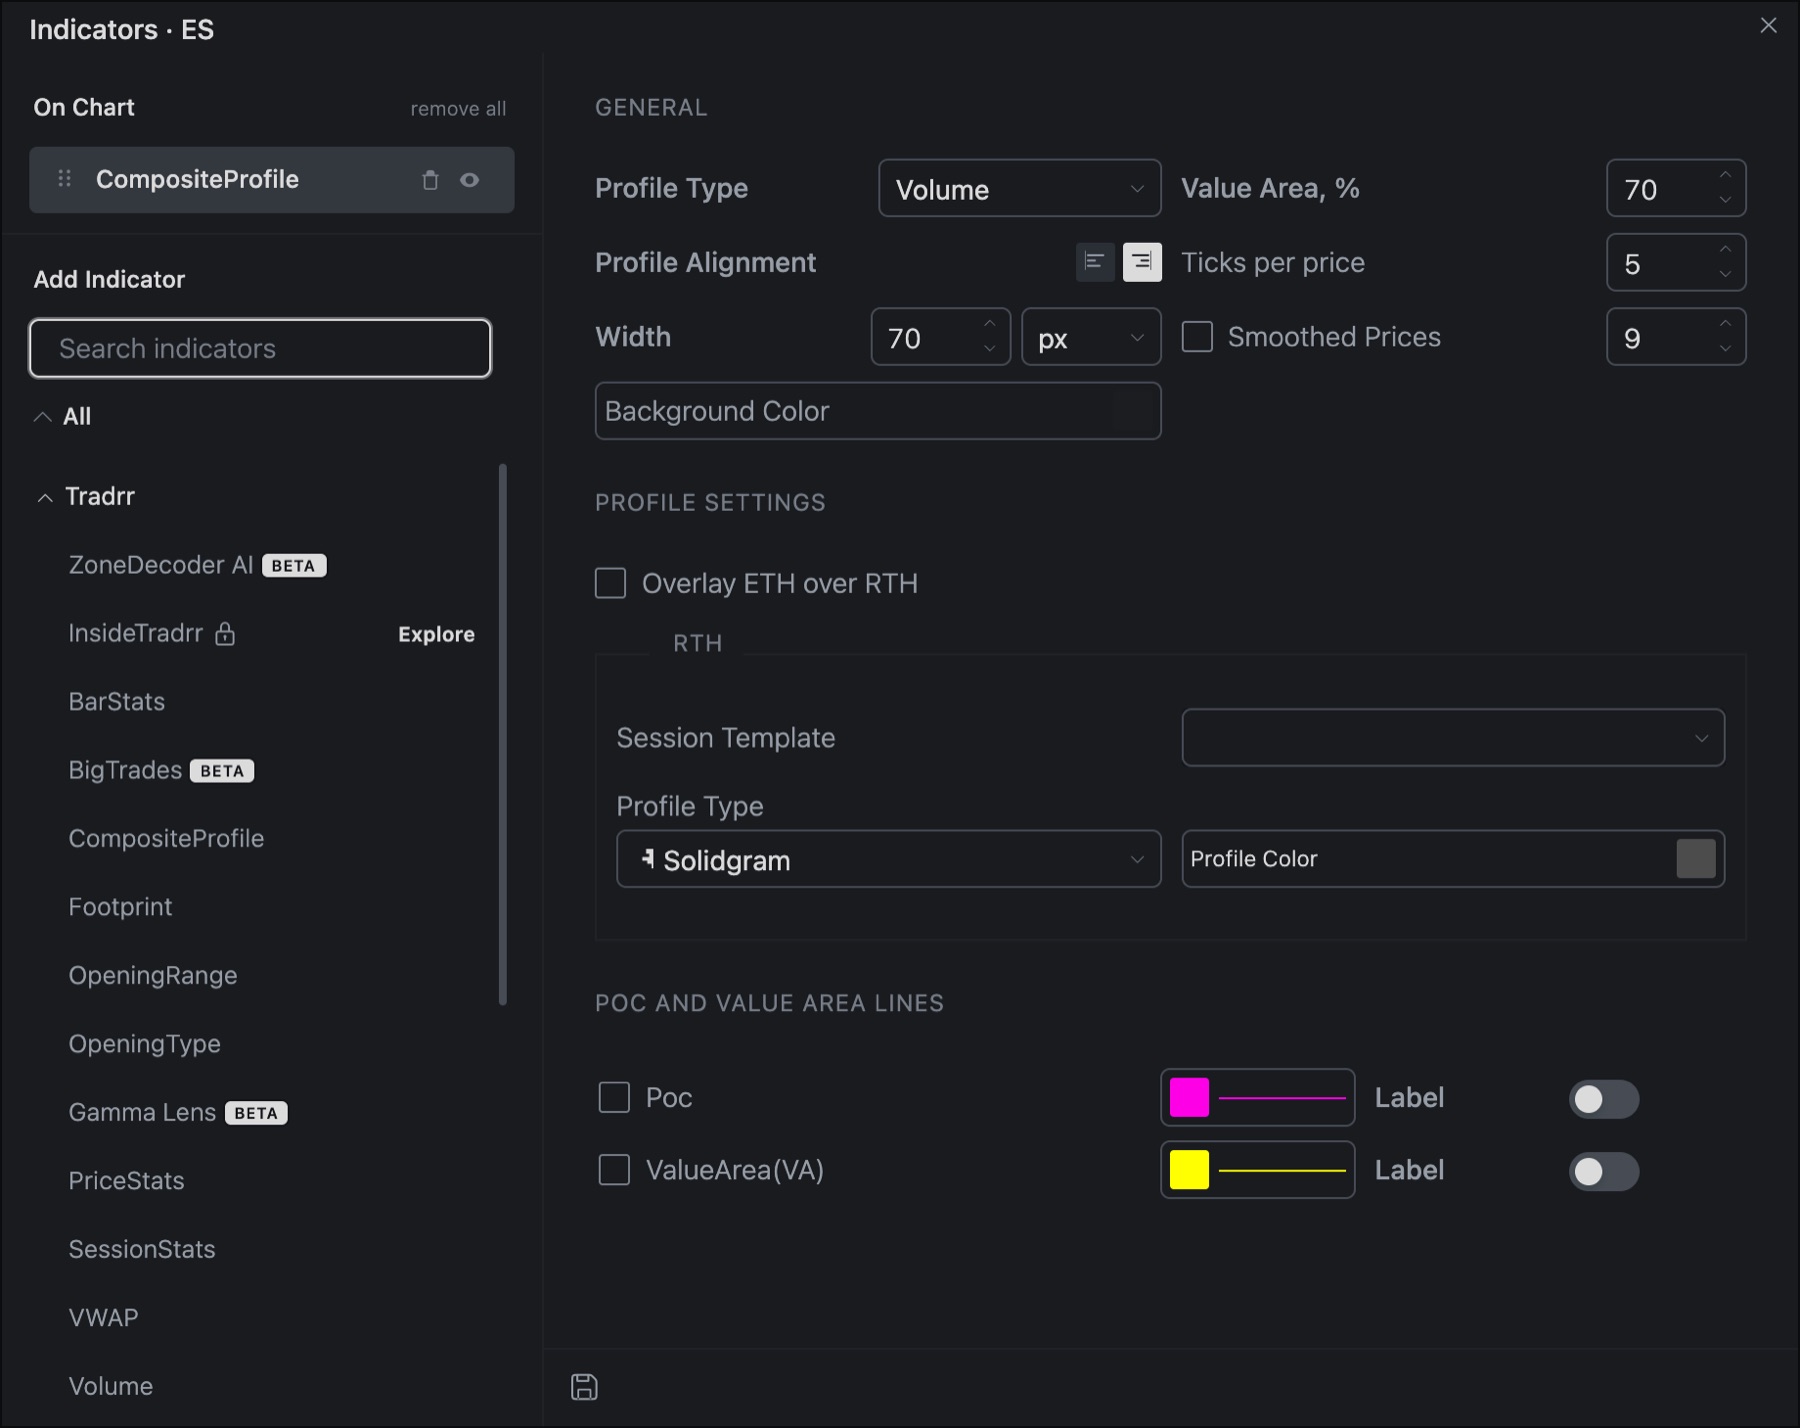
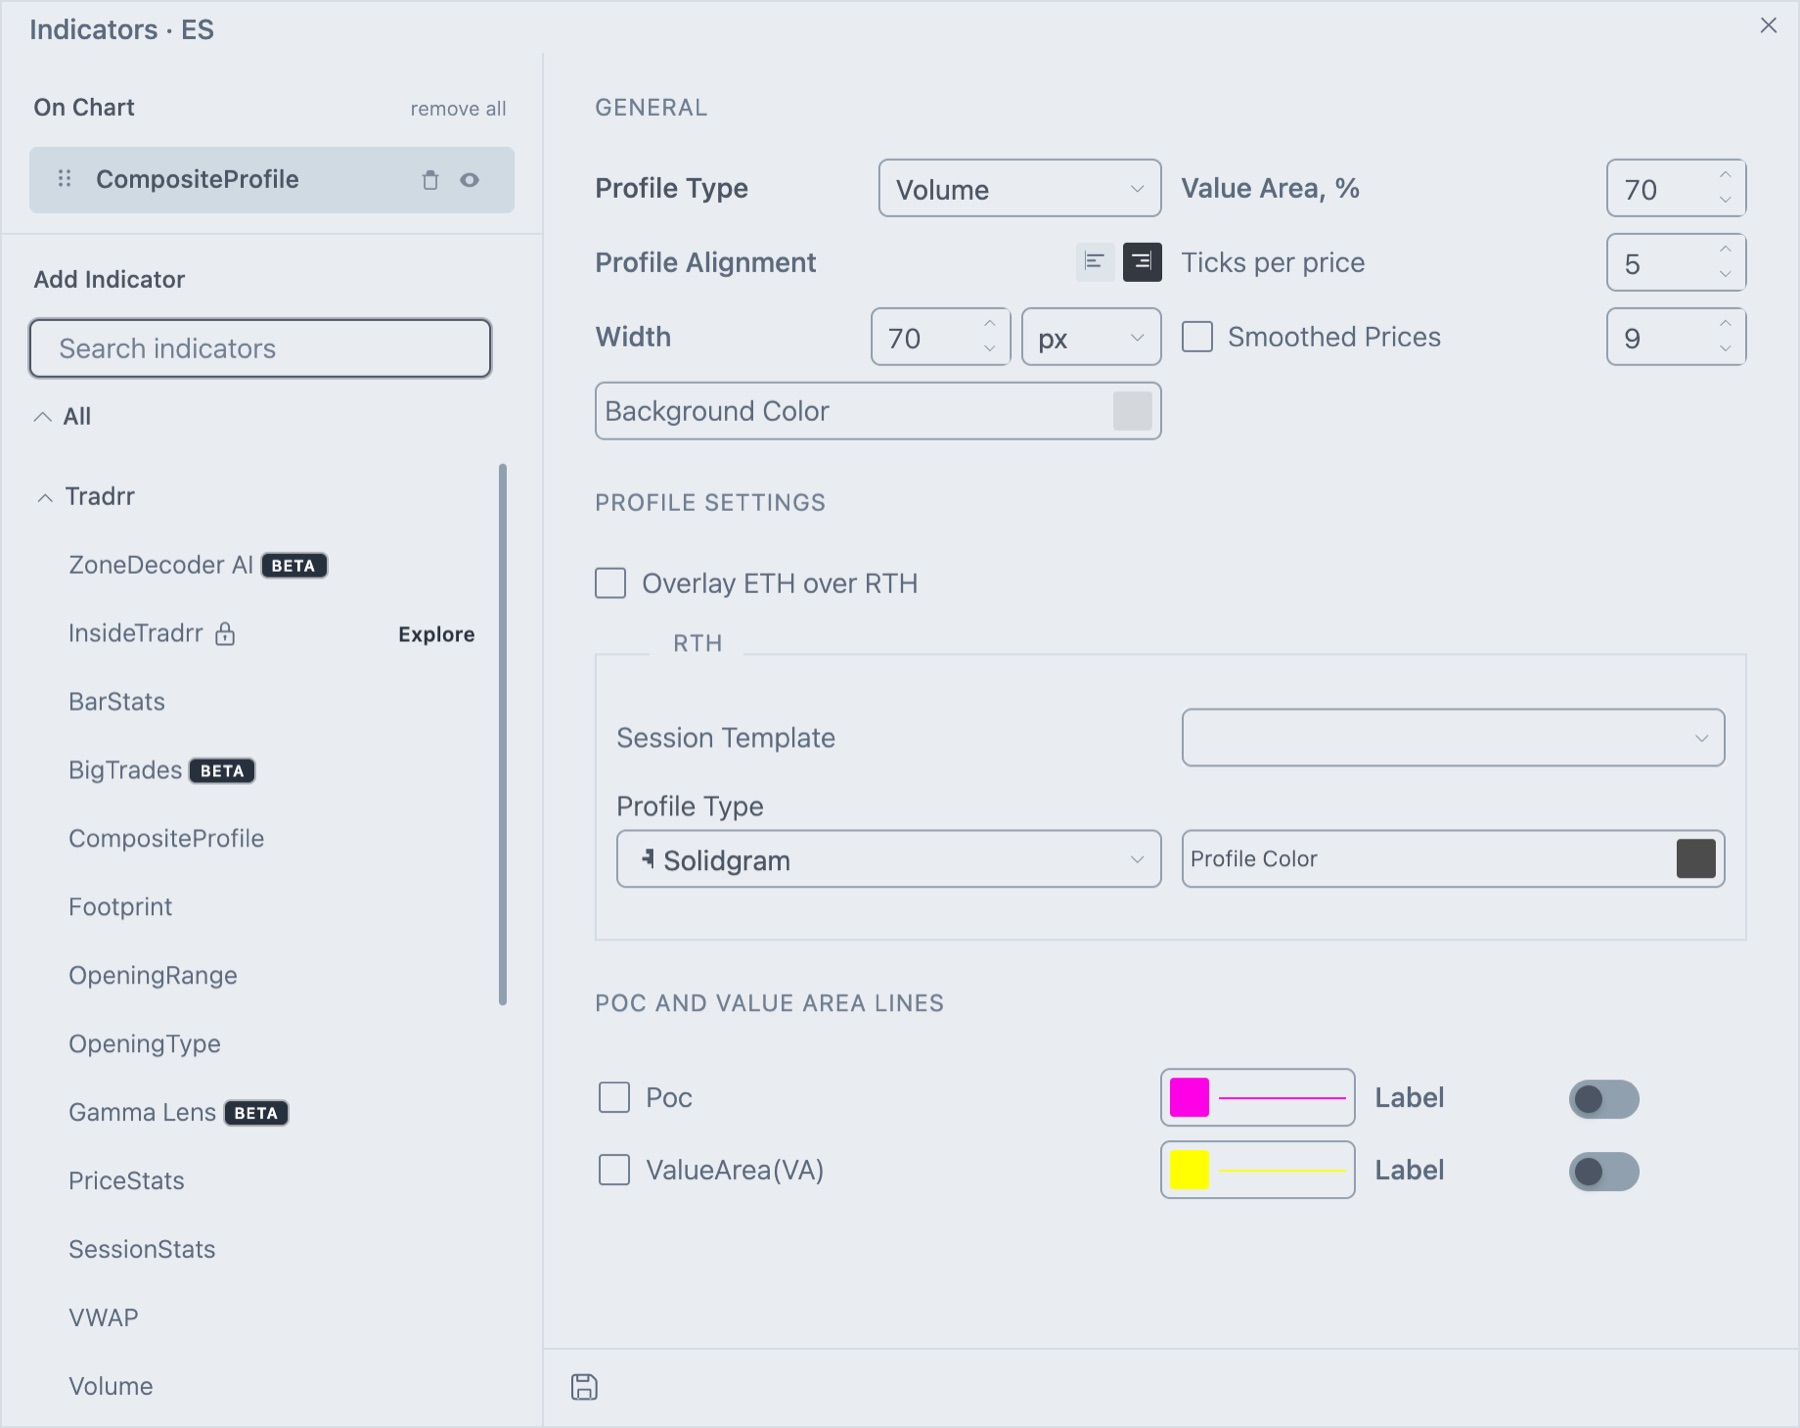
General
| Setting | What it does | Default |
|---|---|---|
| Profile Type | Volume adds contracts traded. Ticks adds the number of trades. Price is also listed. | Volume |
| Value Area, % | Share of volume the value area holds, 0 to 100. | 70 |
| Profile Alignment | Two icon buttons. They dock the column on the left or the right edge of the chart. | Right |
| Ticks per price | Groups prices into rows of this many ticks. Minimum 1. | 5 |
| Width | Width of the column in px or %. | 70 px |
| Smoothed Prices | Tick the box and enter the number of prices to smooth across, in the box on the right. | Off, 9 |
| Background Color | Color behind the column. |
Profile Settings
| Setting | What it does | Default |
|---|---|---|
| Overlay ETH over RTH | Adds a second profile for the extended trading hours on top of the first. The ETH Overlay block appears when it is on. | Off |
| Session Template | The trading hours that feed each profile. Set it in the RTH block, and in the ETH Overlay block when the overlay is on. It starts empty. | Empty |
| Profile Type | The shape, in each block: Hollow Blocks, Dots, Lines, Hollowgram, Solidgram, Filled Line, Hollow Line or Solid Block. | Solidgram |
| Color mode | The dropdown beside the shape: Profile Color, Heat Map, Custom Blend or FP Shading. | Profile Color |
POC and Value Area Lines
| Setting | What it does | Default |
|---|---|---|
| Poc | Draws a line at the POC. Set its color and line style beside the box. | Off |
| ValueArea(VA) | Draws lines at the VA high and low. Set color and line style beside the box. | Off |
| Label | A switch under each line that shows its price label. | Off |
How traders read it
- POC: the price that attracted the most trading across the loaded history. Price often reacts there.
- Value area edges: price outside the value area has moved away from where most trading happened.
- Thin areas: gaps between heavy areas mark prices price moved through quickly.
Tip. The profile covers what is loaded, so the shape changes if you load more history. Keep the same amount of history when you compare days.
Related articles
Was this article helpful?