Price Stats
Price Stats puts three compact profiles next to your chart: one for the current session, one for the previous session and one for the last several days combined. Each shows where trading happened at each price and marks the point of control and the value area.
- Shows
- Current, Previous and multi-day profiles
- Updates
- Live, as the current session trades
- Best on
- Time charts (not available on tick charts)
What it measures
A profile counts activity at each price instead of at each moment in time. Price Stats builds one profile per column and keeps the columns narrow, so they fit beside the bars.
- Point of control (POC): the price with the most activity in the profile.
- Value area (VA): the band of prices around the POC that holds a set share of the activity. You choose the share with Value Area, %.
The first Profile Type setting decides what is counted at each price. Volume counts contracts traded. Ticks counts the number of trades.
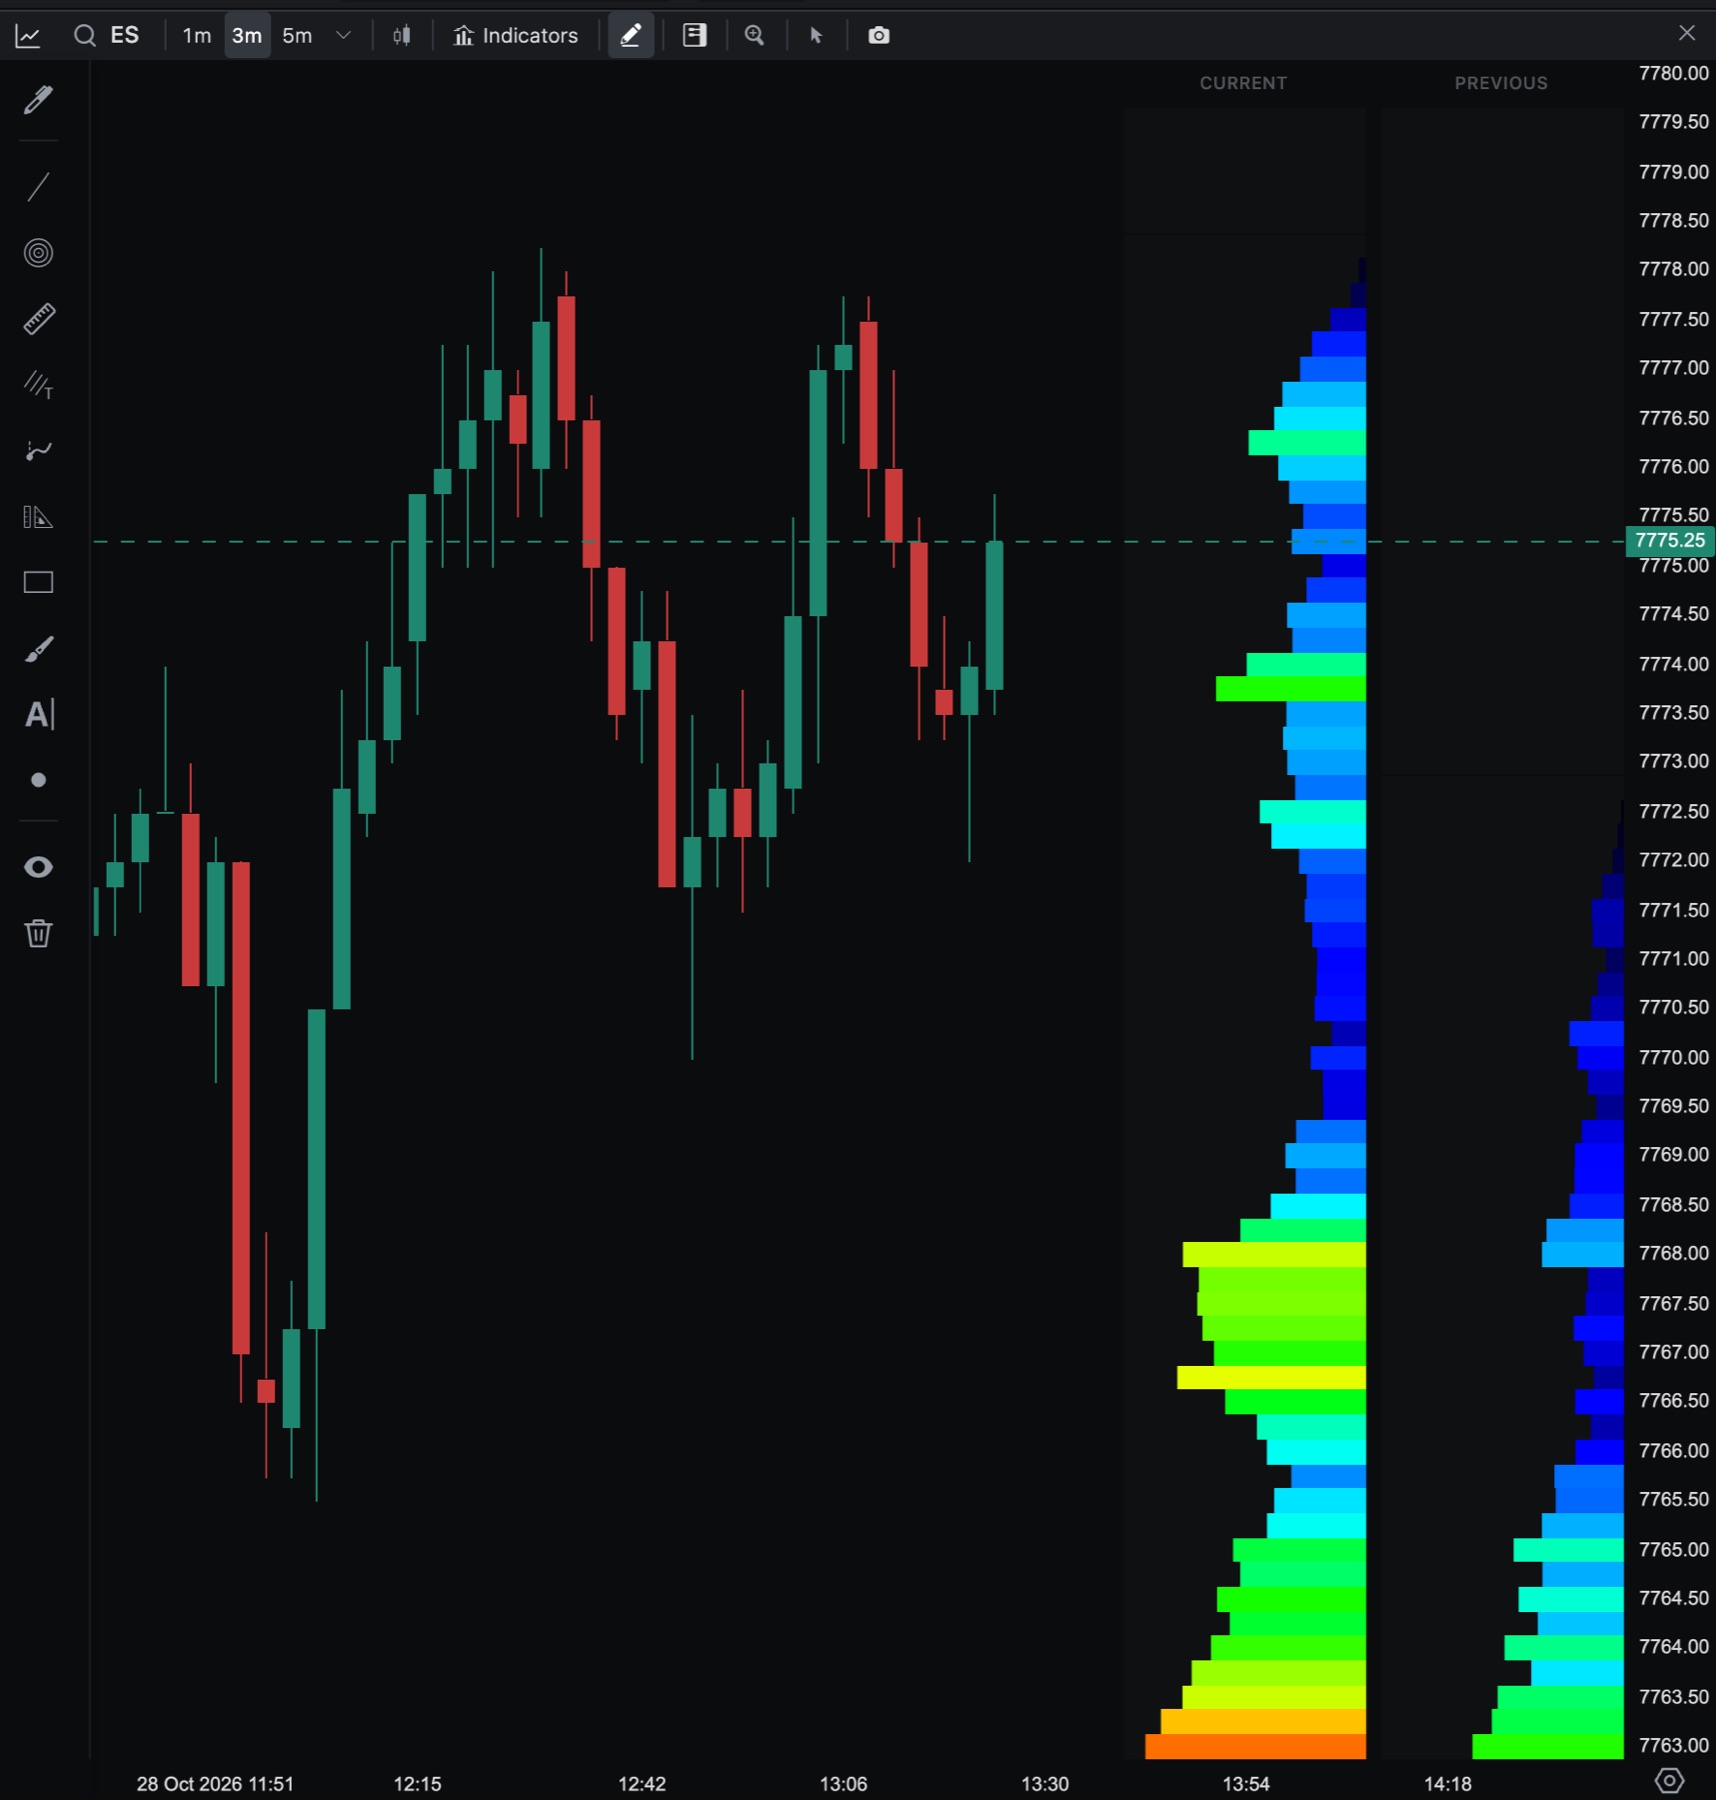
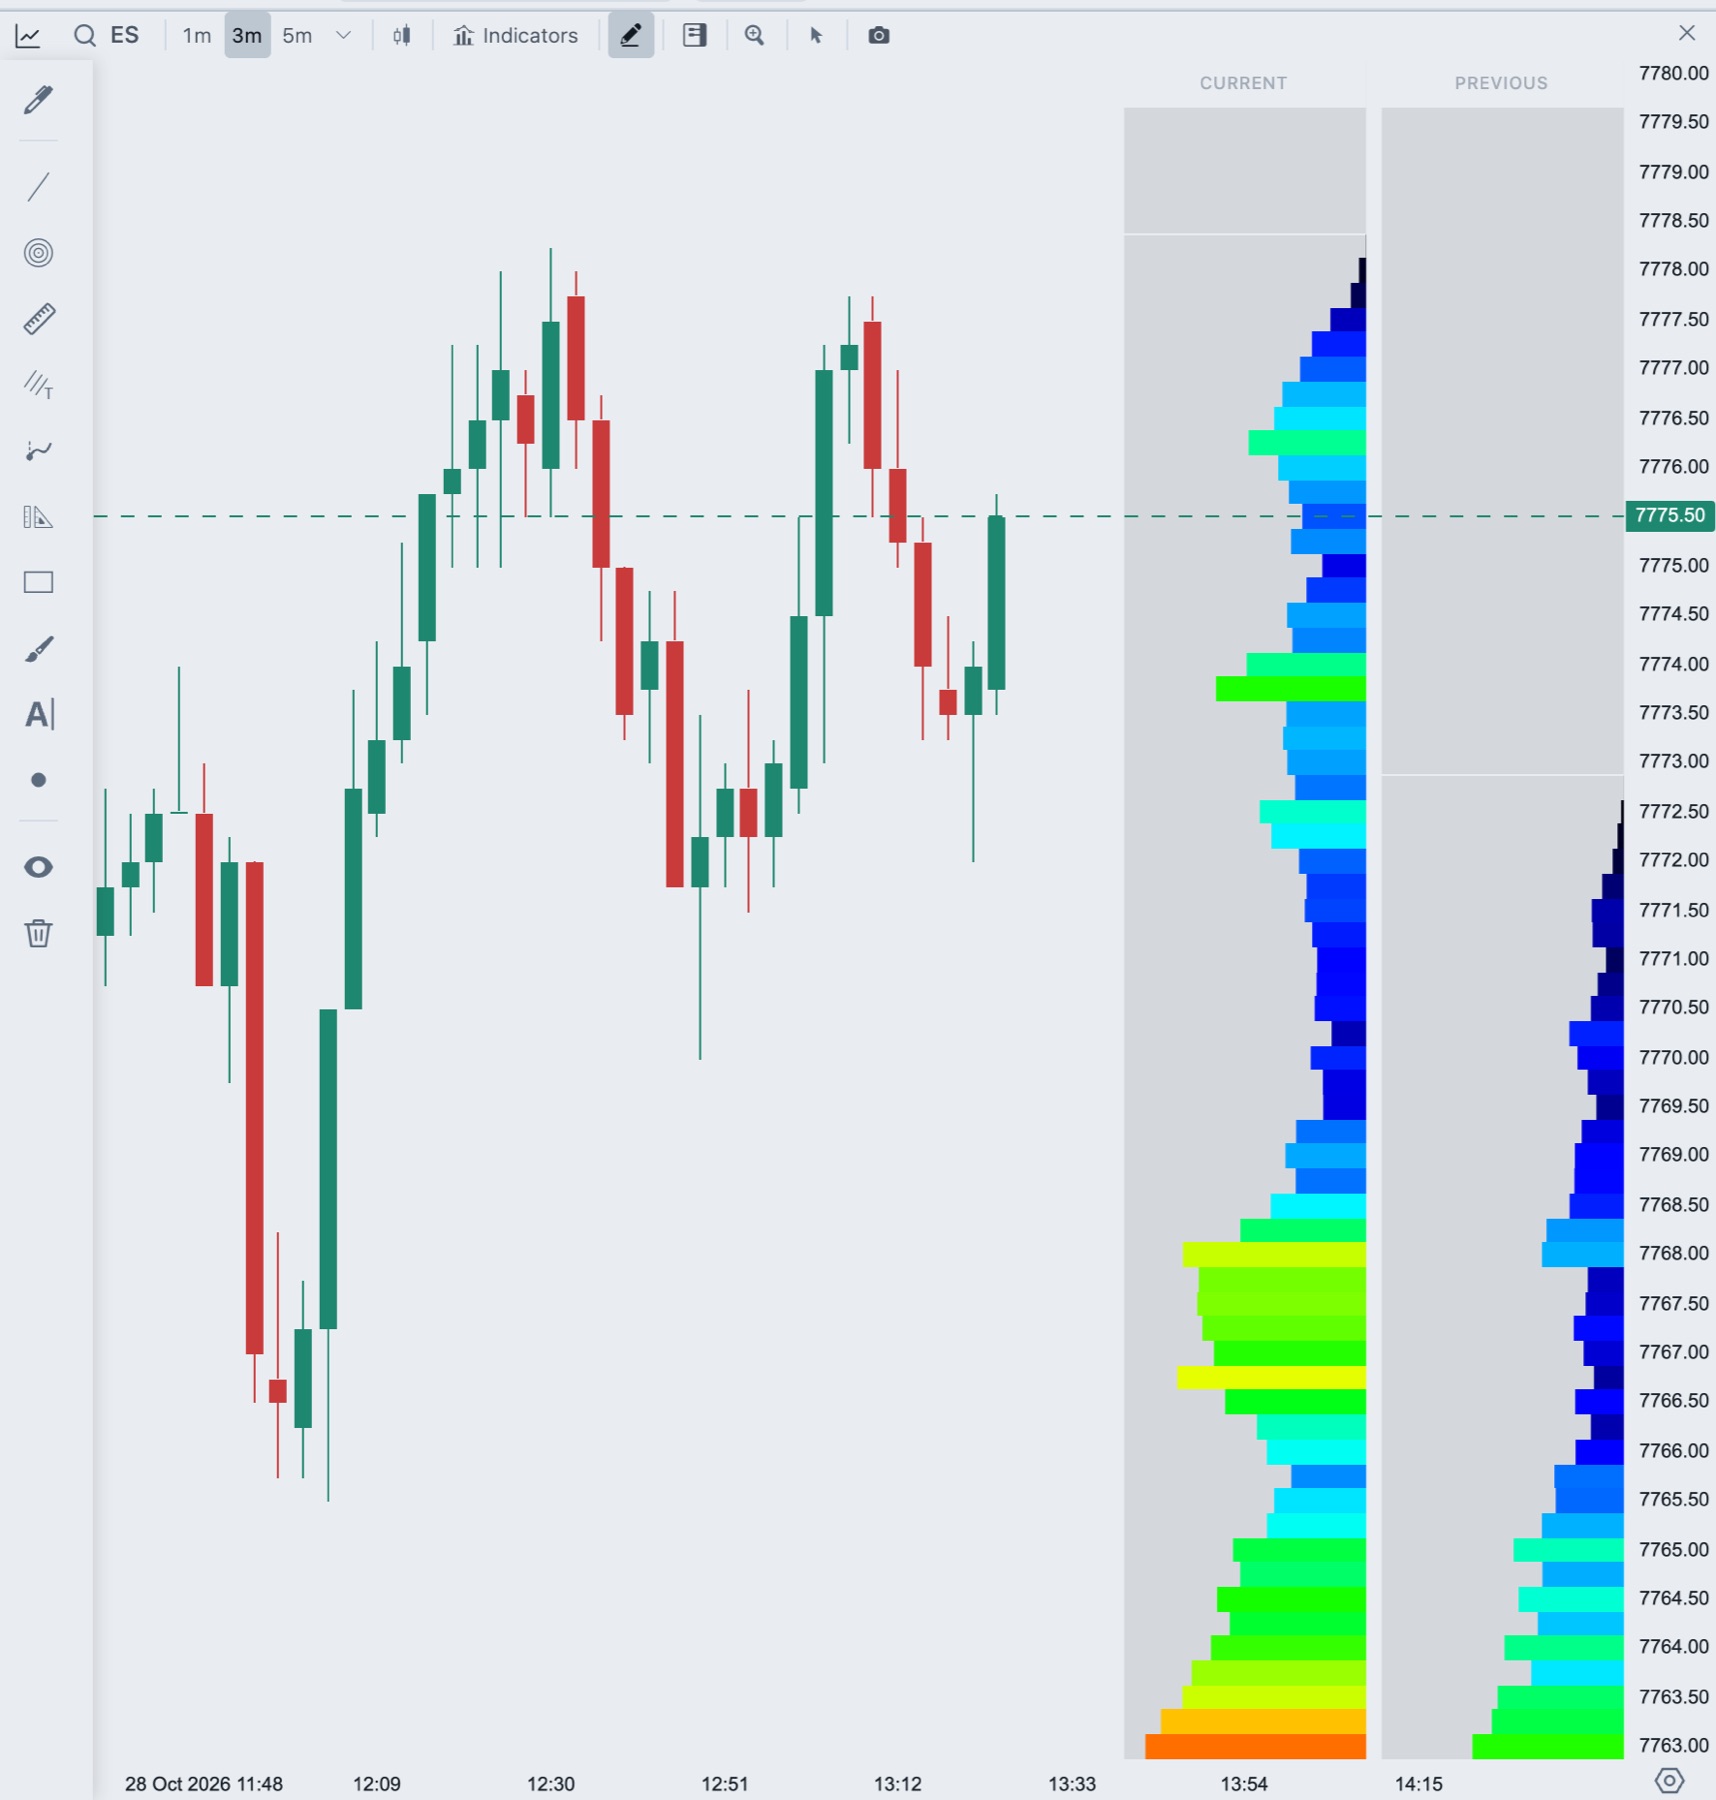
Add Price Stats to a chart
- In the chart header, click Indicators.
- Under Add Indicator, type
PriceStatsin Search indicators, or open the Tradrr group. The name has no space. - Click PriceStats. It is added to the chart and its settings open on the right.
You can add one Price Stats to a chart. It is not available on tick charts. Hover it in the list and you'll see "This indicator is not compatible with TICK periodicity".
Settings
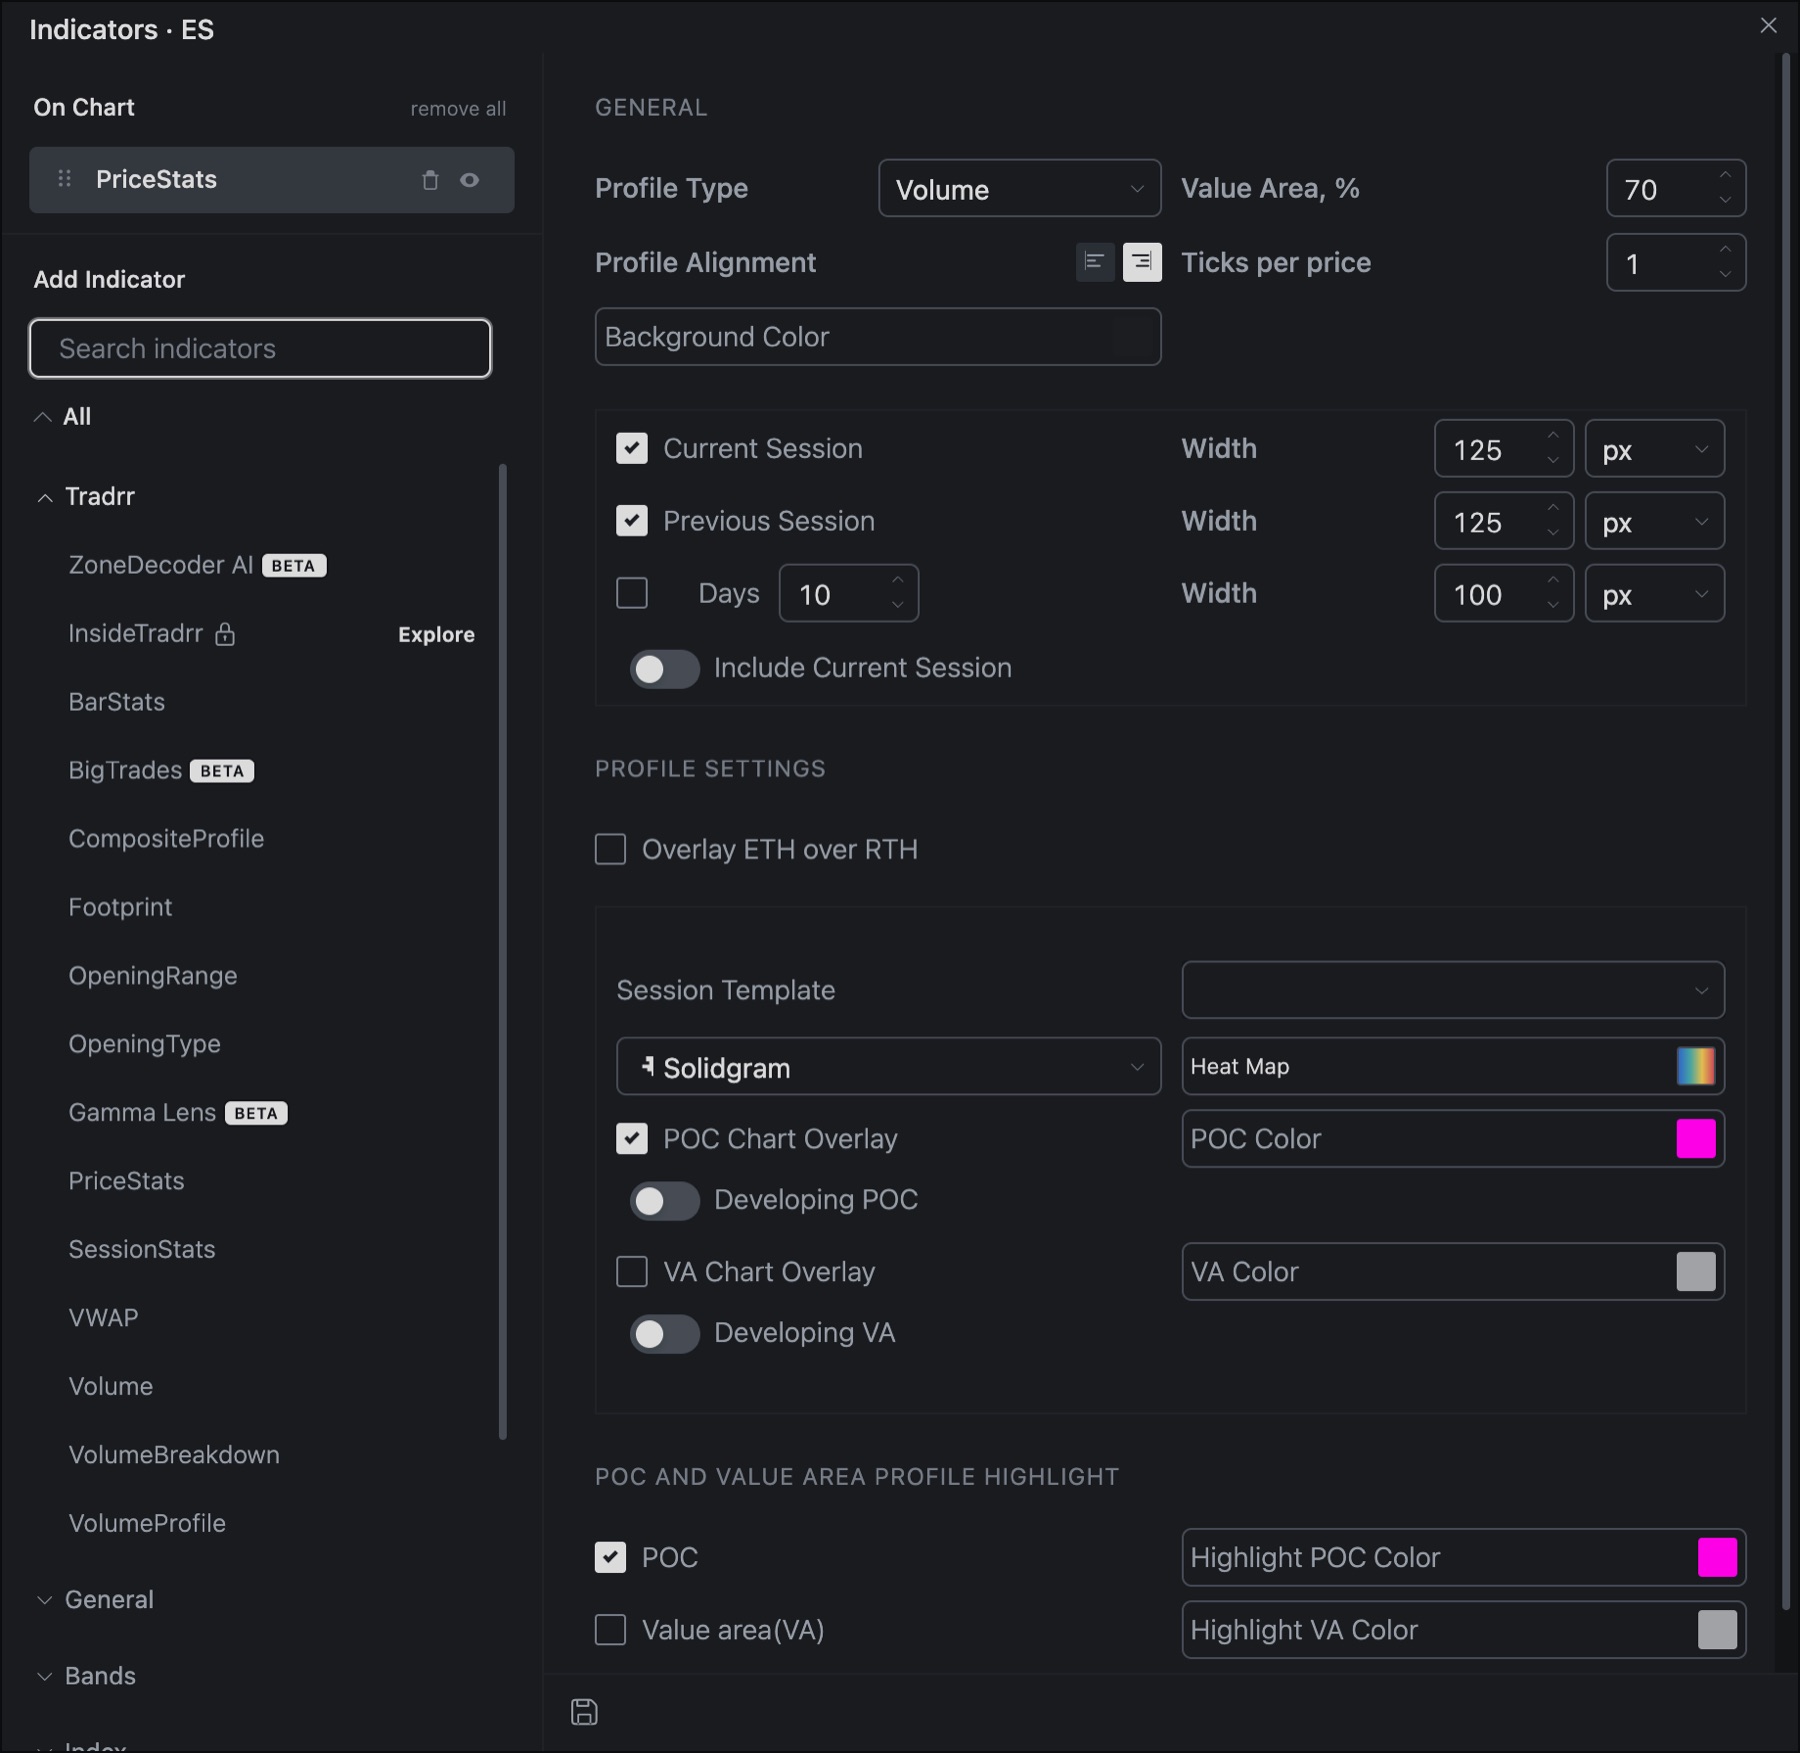
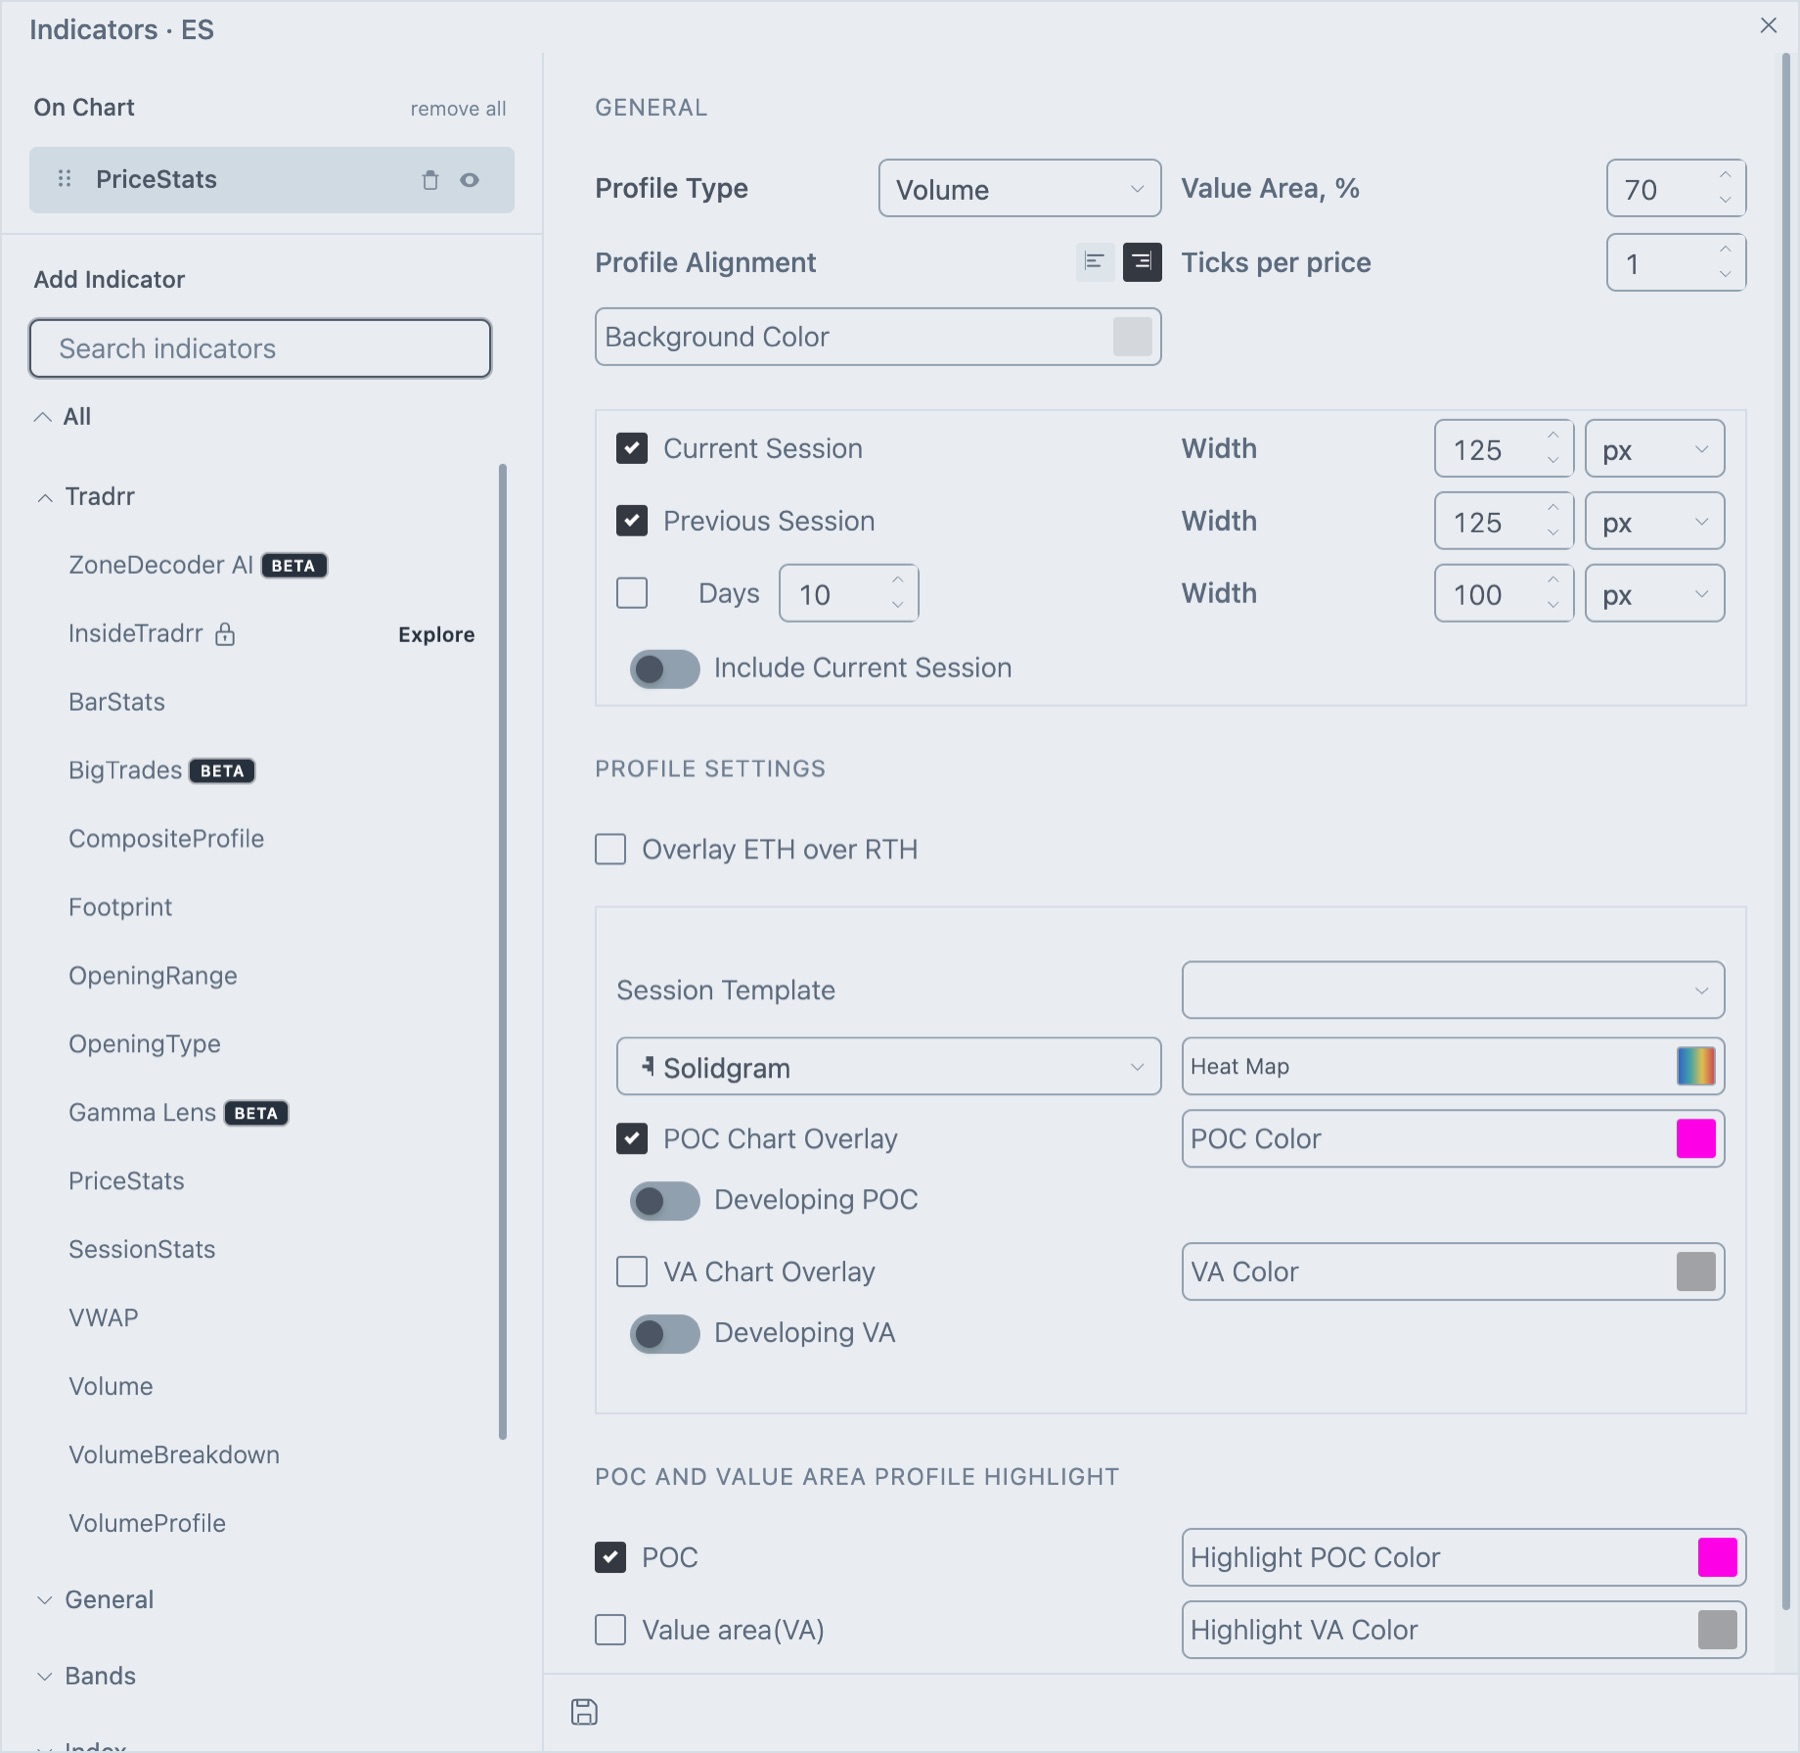
General
| Setting | What it does | Default |
|---|---|---|
| Profile Type | Volume, Ticks or Price. Chooses what the profile counts at each price. | Volume |
| Value Area, % | Share of activity the value area covers, from 0 to 100. | 70 |
| Profile Alignment | Two icon buttons. They set which side the profile bars grow from. | Right |
| Ticks per price | Groups this many ticks into one profile row. A higher number gives a smoother, shorter profile. | 1 |
| Background Color | Color behind the profile columns. | |
| Current Session | Checkbox and Width. Shows the profile of the session in progress. | On, 125 px |
| Previous Session | Checkbox and Width. Shows the profile of the session before it. | On, 125 px |
| Days | A checkbox, a day count under the Days label, and Width. Combines the last N days into one profile. | Off, 10 days, 100 px |
| Include Current Session | Adds the session in progress to the multi-day profile. | Off |
Each Width takes a number and a unit, px or %.
Profile Settings
| Setting | What it does | Default |
|---|---|---|
| Overlay ETH over RTH | Draws the extended-hours profile over the regular-hours profile. Turning it on shows the ETH Overlay block, which has the same options as the RTH block. | Off |
| Session Template | The session this block uses. Manage templates in Session Manager. | Empty |
| Profile Type | Shape of the profile: Hollow Blocks, Dots, Lines, Hollowgram, Solidgram, Filled Line, Hollow Line or Solid Block. | Solidgram |
| Profile color | The color dropdown beside the shape: Profile Color, Heat Map, Custom Blend or FP Shading. | Heat Map |
| POC Chart Overlay | Draws the point of control as a line on the chart. The Developing POC switch also shows how the POC moved during the session. POC Color sets the color. | On, pink, Developing POC off |
| VA Chart Overlay | Draws the value area high and low as lines on the chart. The Developing VA switch also shows how they moved during the session. VA Color sets the color. | Off, grey, Developing VA off |
POC and Value Area Profile Highlight
| Setting | What it does | Default |
|---|---|---|
| POC | Highlights the point of control in the profile. Highlight POC Color sets the color. | On |
| Value area(VA) | Highlights the rows inside the value area. Highlight VA Color sets the color. | Off |
How traders read it
- Price near the POC: the market is trading at a price it has accepted. Moves tend to slow here.
- Price outside the value area: price is testing the edge of accepted value. Acceptance back inside often points to a return toward the POC. Sustained trade outside it points to a new range.
- Previous session POC and value area: reference points carried into today. Compare them with the current profile to see whether value is moving up, down or staying put.
- Multi-day profile: shows where the market has spent the most activity over several days.
Tip. Keep Align with PriceStats on in Session Stats so its level lines end where the profiles begin.
Related articles
Was this article helpful?