Opening Range
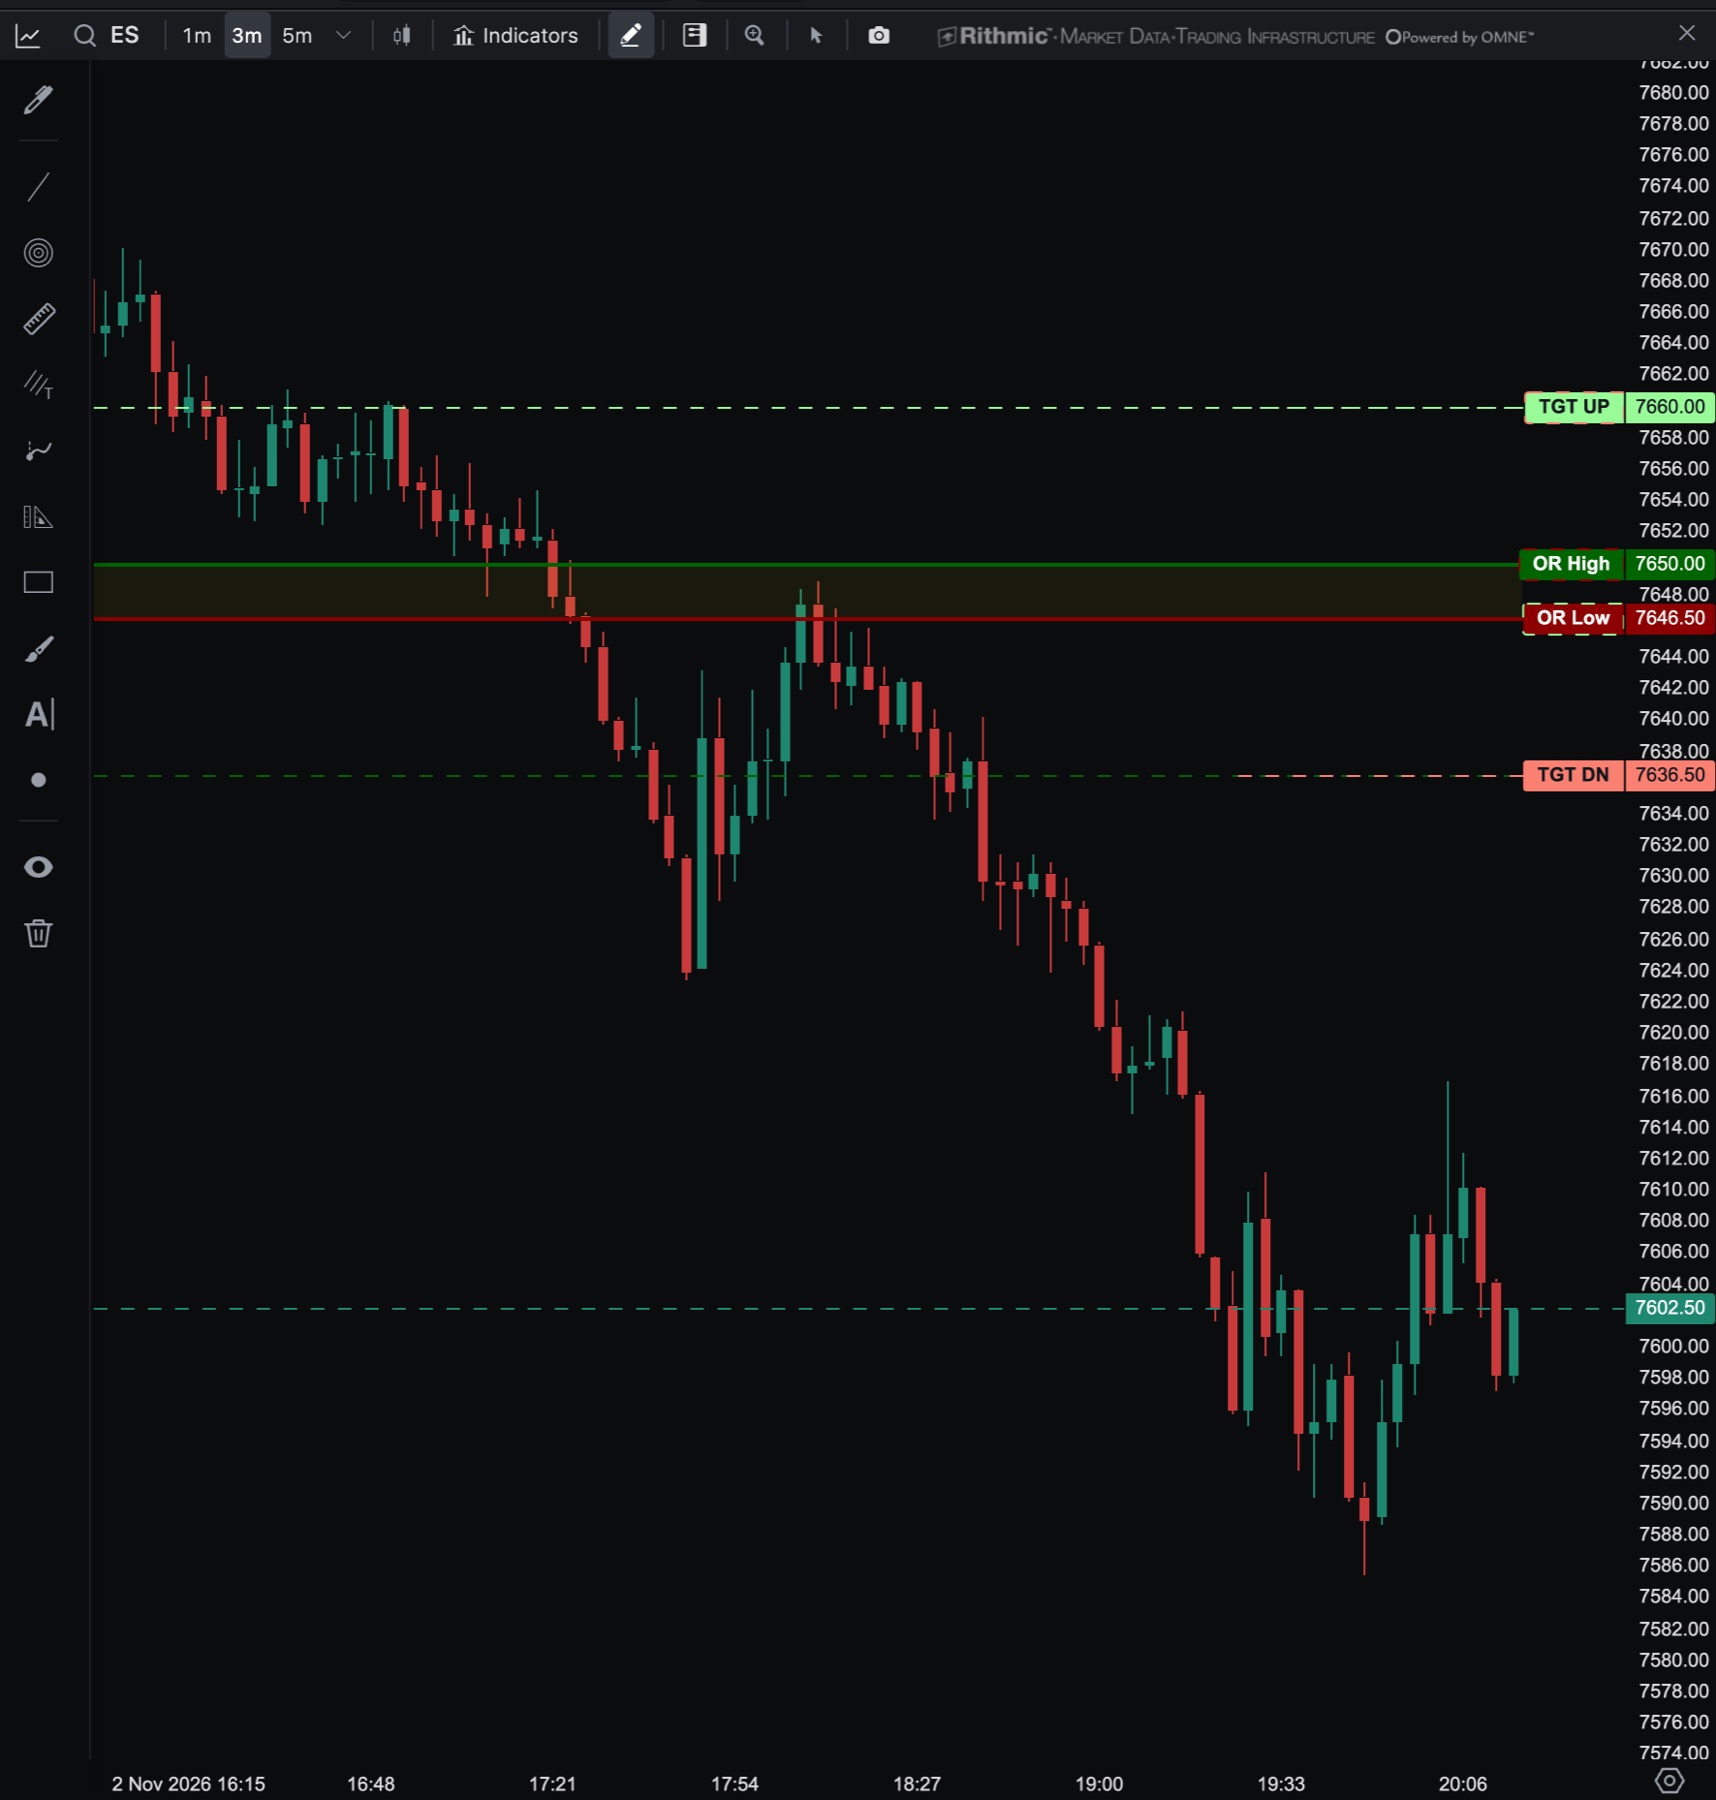
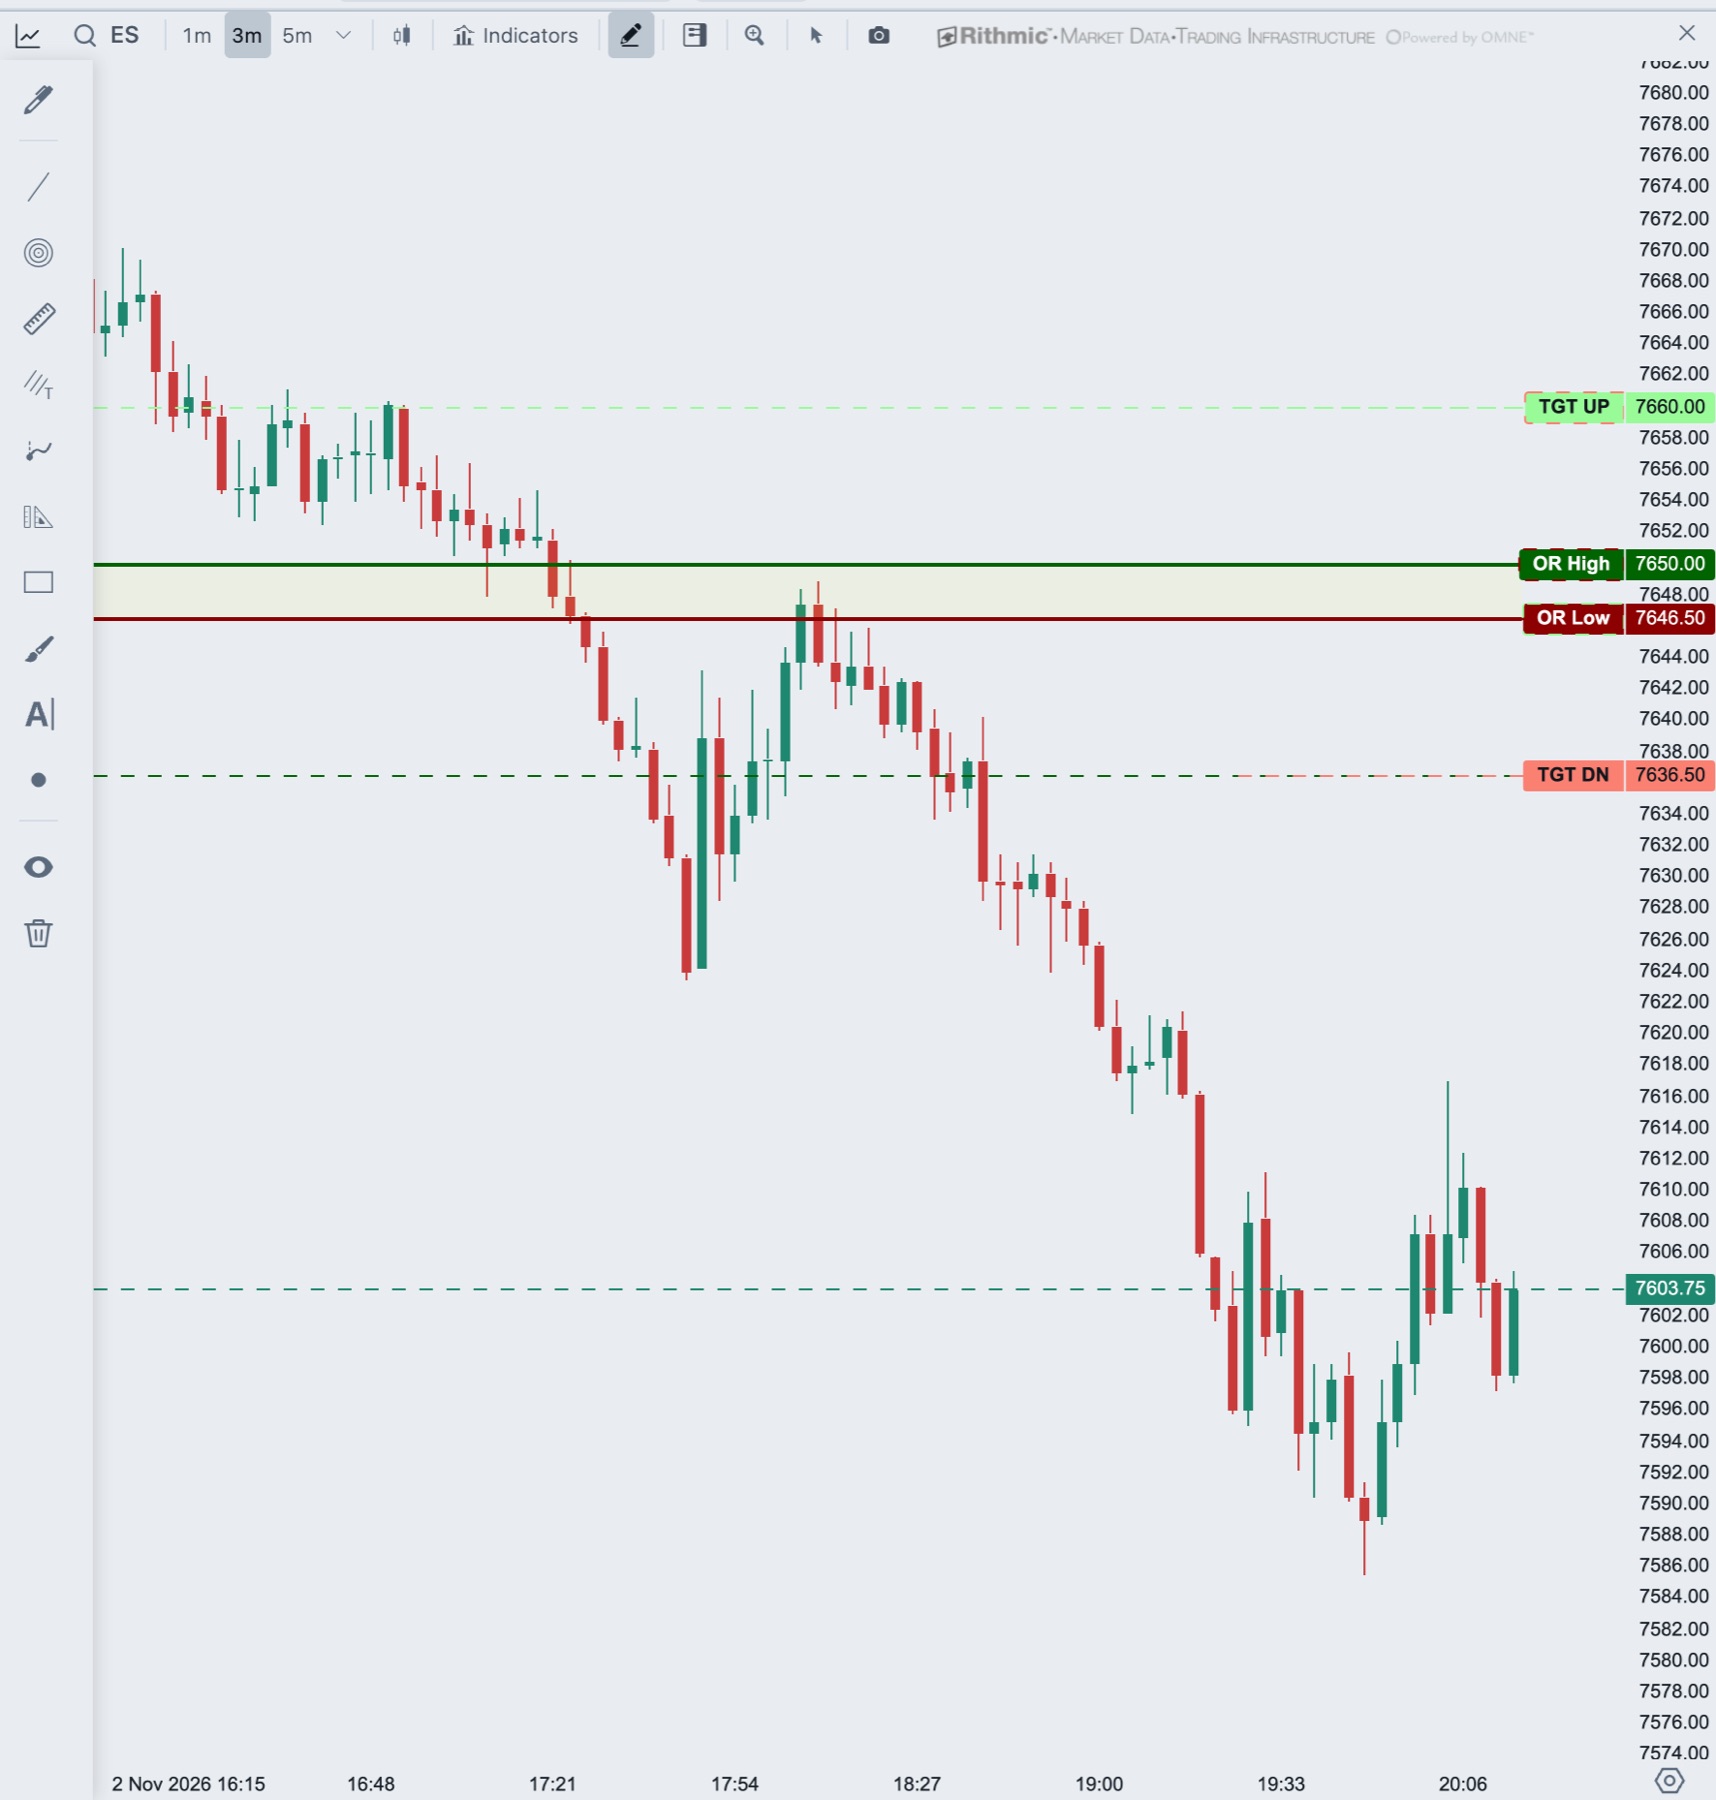
Opening Range marks the high and low of the first minutes after a session opens. The two edges become support, resistance and breakout levels for the rest of the session. Optional target lines sit a fixed number of ticks beyond each edge.
- Shows
- OR High, OR Low, an optional midpoint and two targets
- Resets
- At the start of each session
- Best on
- Intraday time charts
How it is calculated
Opening Range uses the session template you choose and a duration. It takes every bar in that duration after the session starts. The highest high is OR High. The lowest low is OR Low.
Upper Target = OR High + Target distance
Lower Target = OR Low - Target distance
The target distance is a number of ticks, so it adapts to the instrument. The shaded box between OR High and OR Low and the lines span the whole session. The chart shows the last 10 sessions.
Add Opening Range to a chart
- In the chart header, click Indicators.
- Under Add Indicator, type
OpeningRangein Search indicators, or open the Tradrr group. The name has no space. - Click OpeningRange. It is added to the chart and its settings open on the right.
You can add one Opening Range to a chart.
Settings
Range
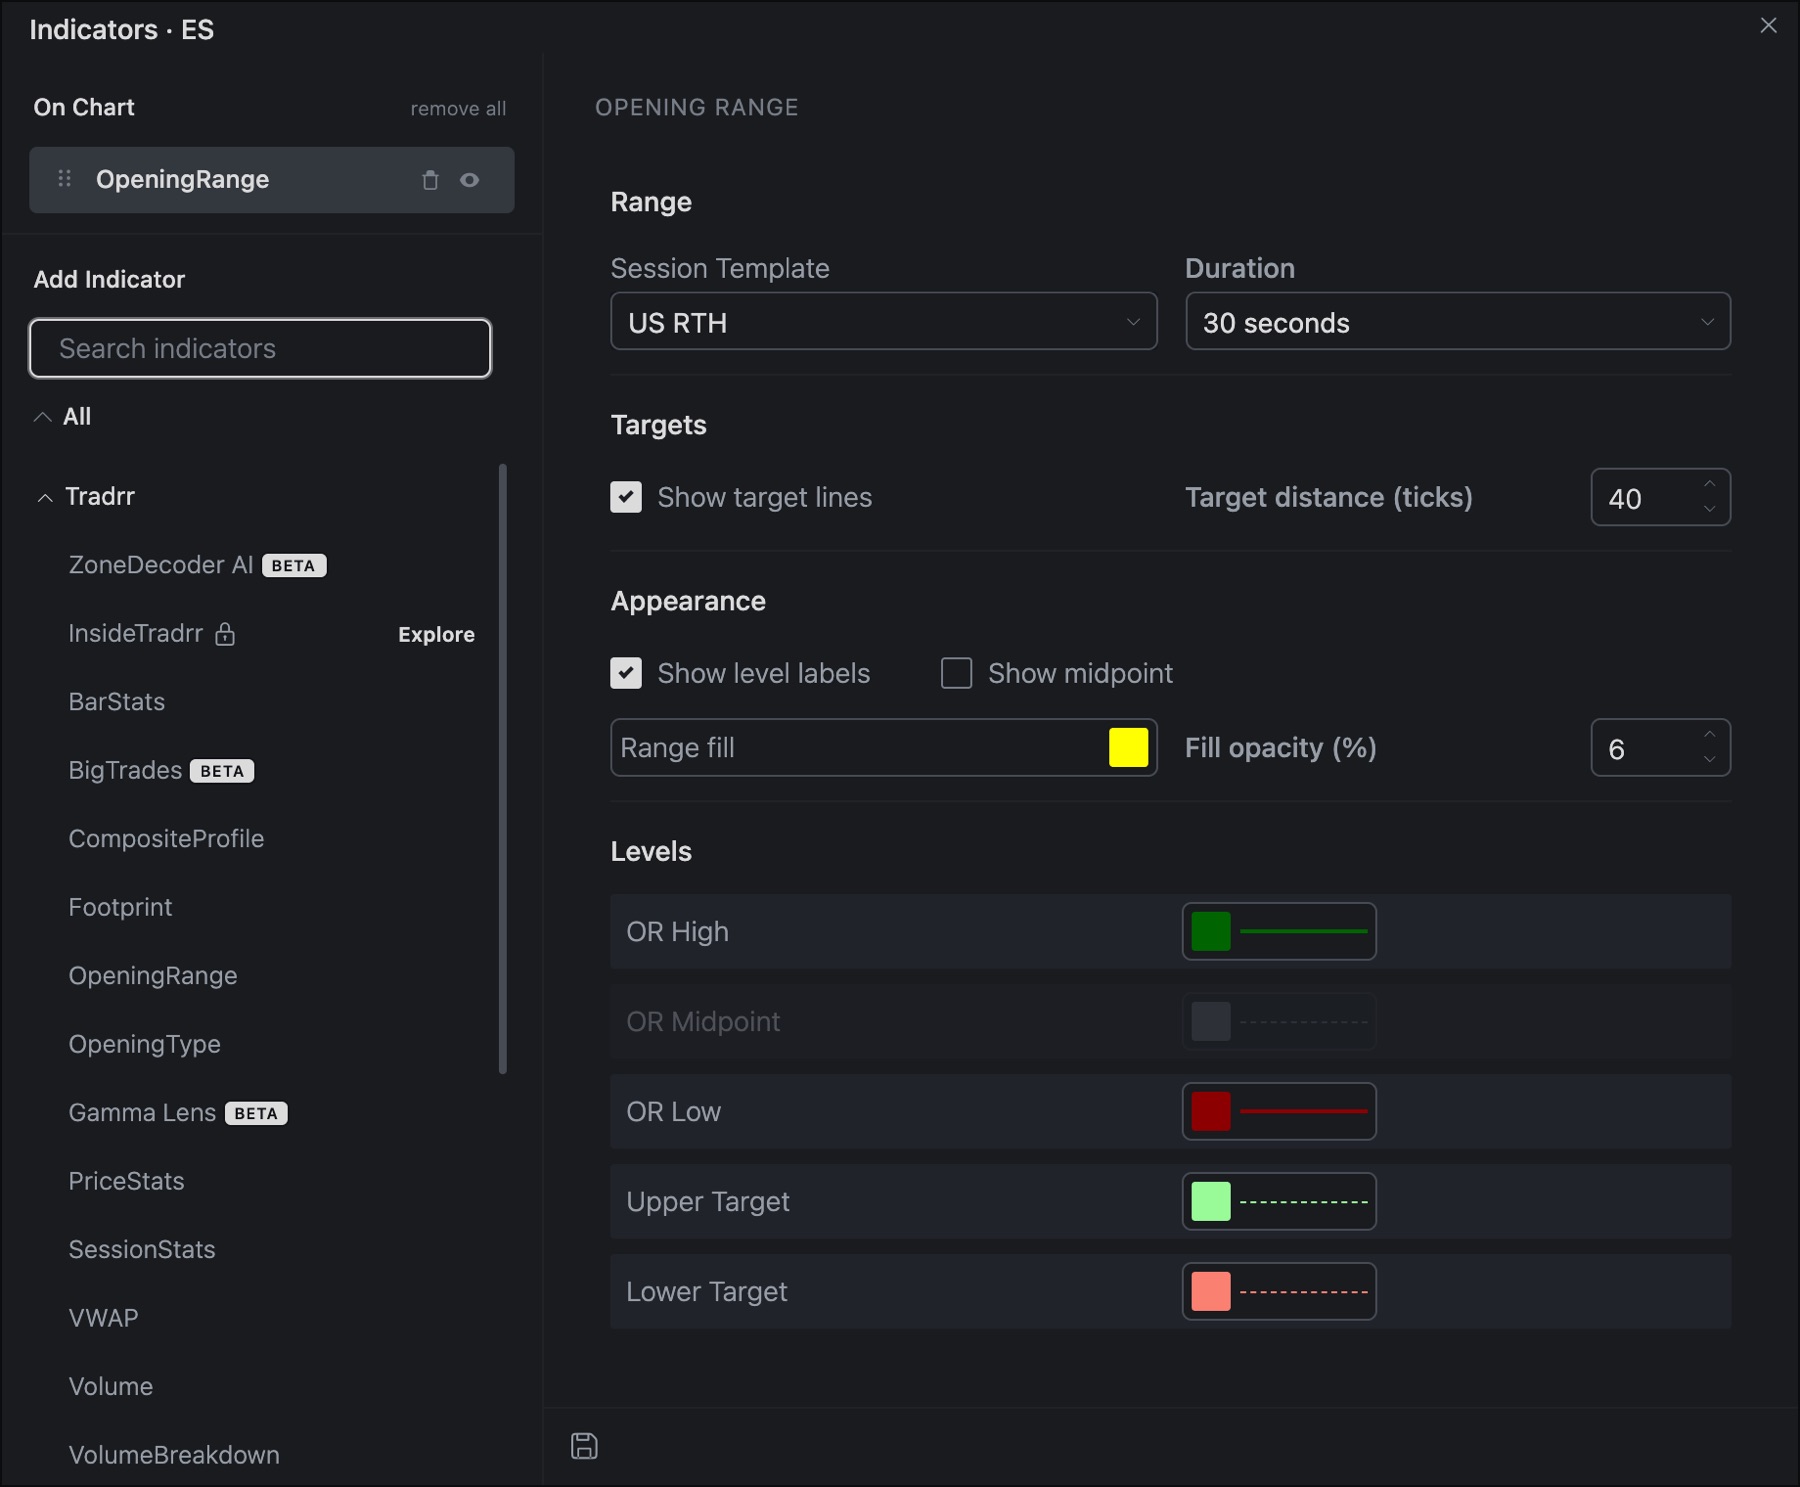
| Setting | What it does | Default |
|---|---|---|
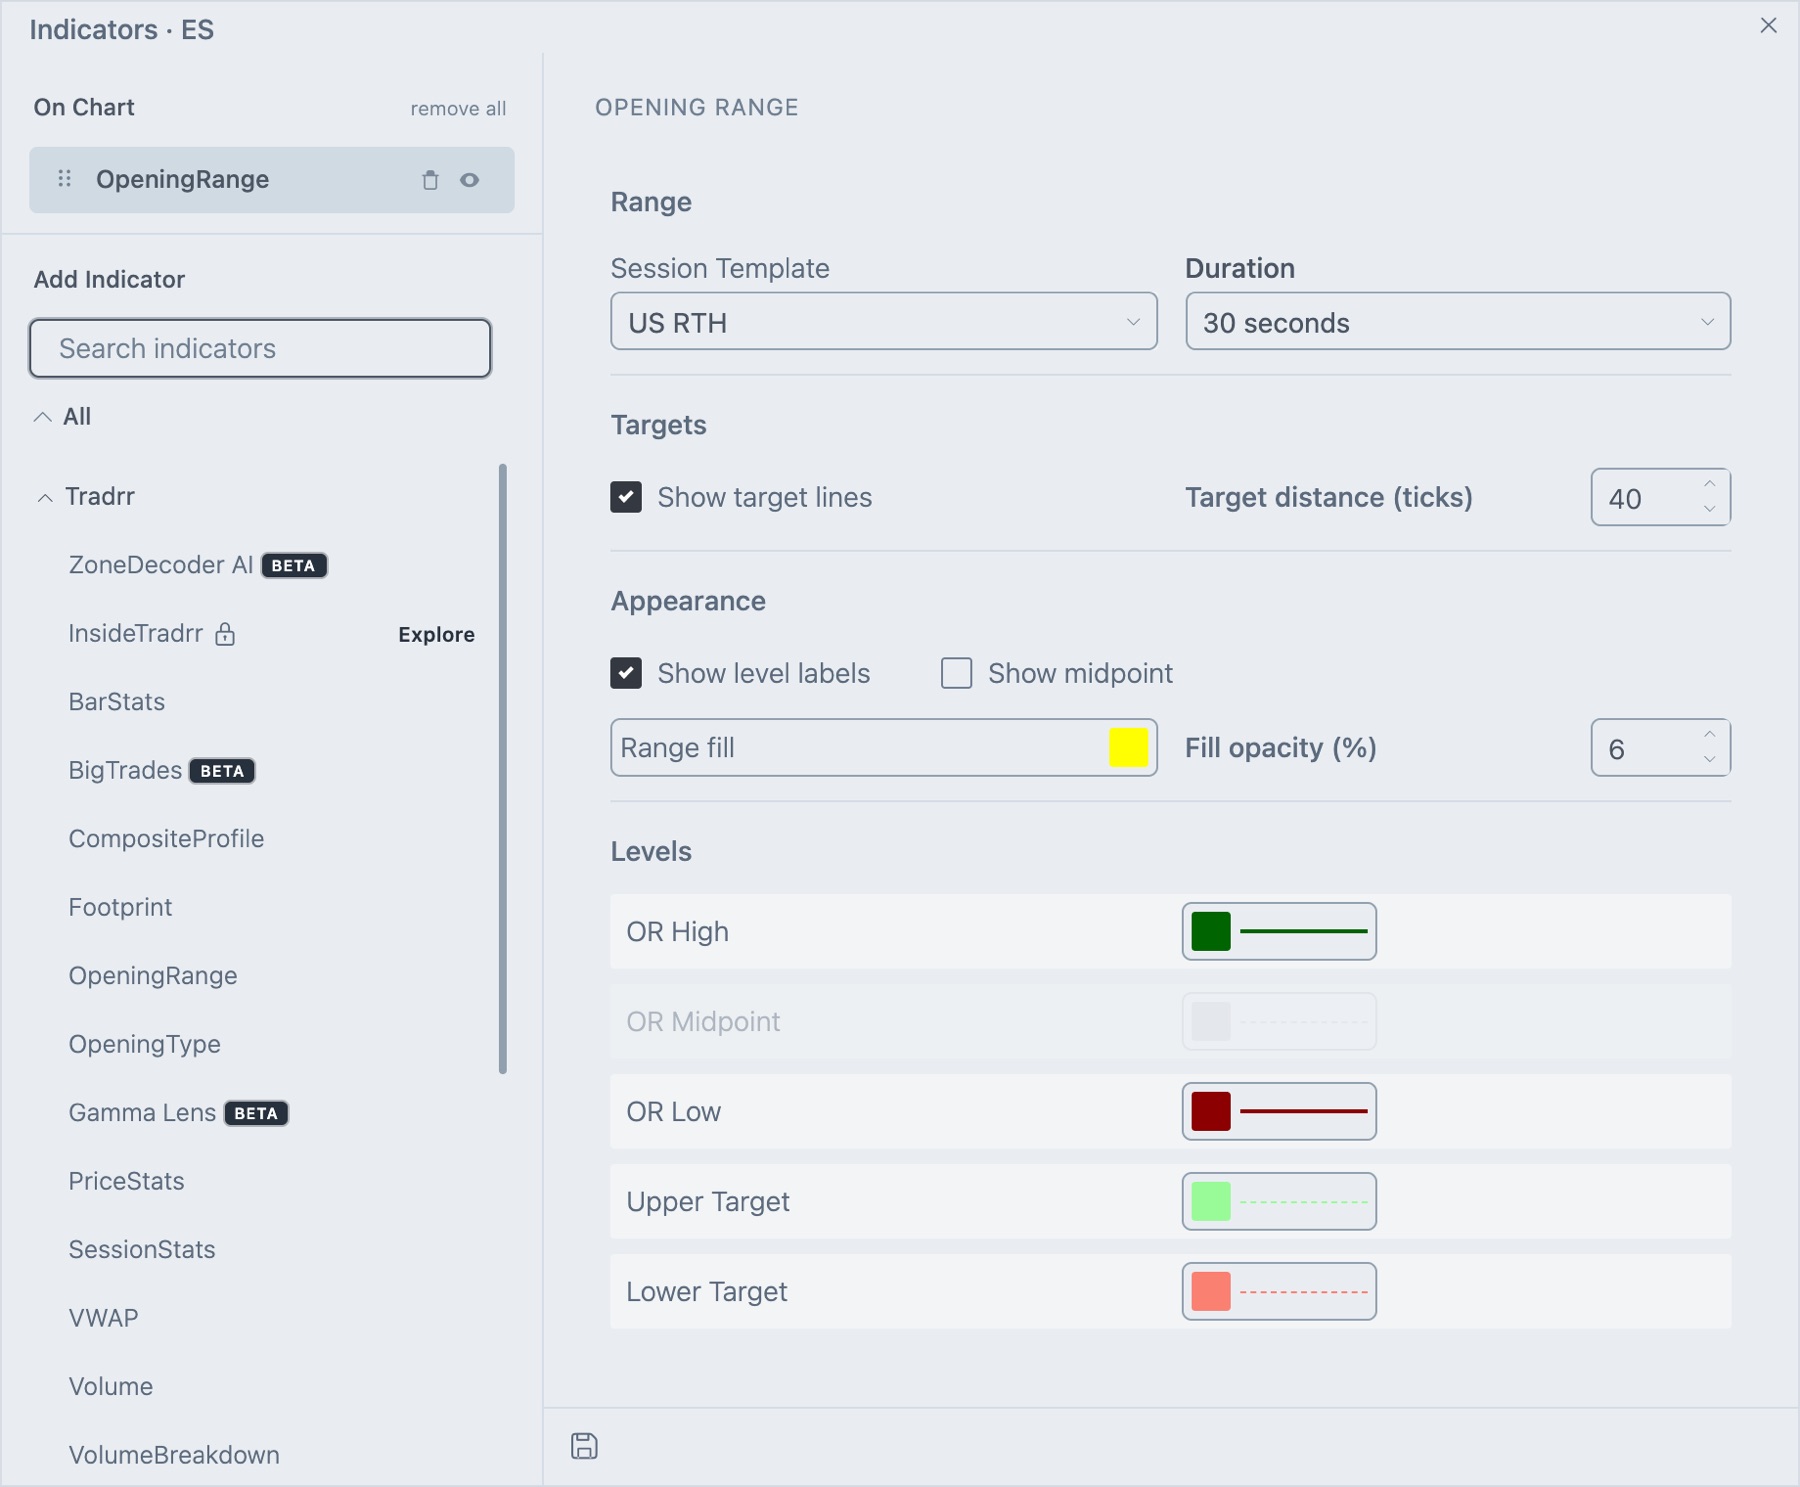
| Session Template | The session whose start begins the range. Manage templates in Session Manager. | US RTH, starting 09:30 New York time |
| Duration | How long after the session start the range keeps updating: 30 seconds, 1 minute, 5 minutes, 10 minutes, 15 minutes, 30 minutes or 60 minutes. | 30 seconds |
Targets
| Setting | What it does | Default |
|---|---|---|
| Show target lines | Draws the Upper Target and Lower Target lines. | On |
| Target distance (ticks) | Distance from OR High up and from OR Low down, in ticks. Disabled while target lines are off. | 40 |
Appearance
| Setting | What it does | Default |
|---|---|---|
| Show level labels | Labels the lines OR High, OR Mid, OR Low, TGT UP and TGT DN at the price scale. Labels show for the latest visible session. | On |
| Show midpoint | Draws the midpoint line. | Off |
| Range fill | Color of the shaded box between the high and the low. | Yellow |
| Fill opacity (%) | How solid the box is, from 0 to 100. Set 0 for no fill. | 6 |
Levels
Each level has a color and a line style (width and dash type).
| Level | Default look |
|---|---|
| OR High | Dark green, solid, 2 px |
| OR Midpoint | Grey, dashed, 1 px. Used only when Show midpoint is on. |
| OR Low | Dark red, solid, 2 px |
| Upper Target | Light green, dashed, 1 px. Used only when target lines are on. |
| Lower Target | Salmon, dashed, 1 px. Used only when target lines are on. |
How traders read it
- Break above OR High: buyers have taken control of the open. Many traders look for a hold above the high before following.
- Break below OR Low: the same for sellers.
- Price stays inside the range: no side has won. The edges act as support and resistance until one breaks.
- Targets: a fixed-tick measure beyond each edge. Use them as reference exits, not as predictions.
Tip. A short duration gives a tight range that breaks often. A longer one, such as 30 or 60 minutes, gives wider levels that matter more when they break. Try both on Market Replay before you pick one.
Related articles
Was this article helpful?