Regression
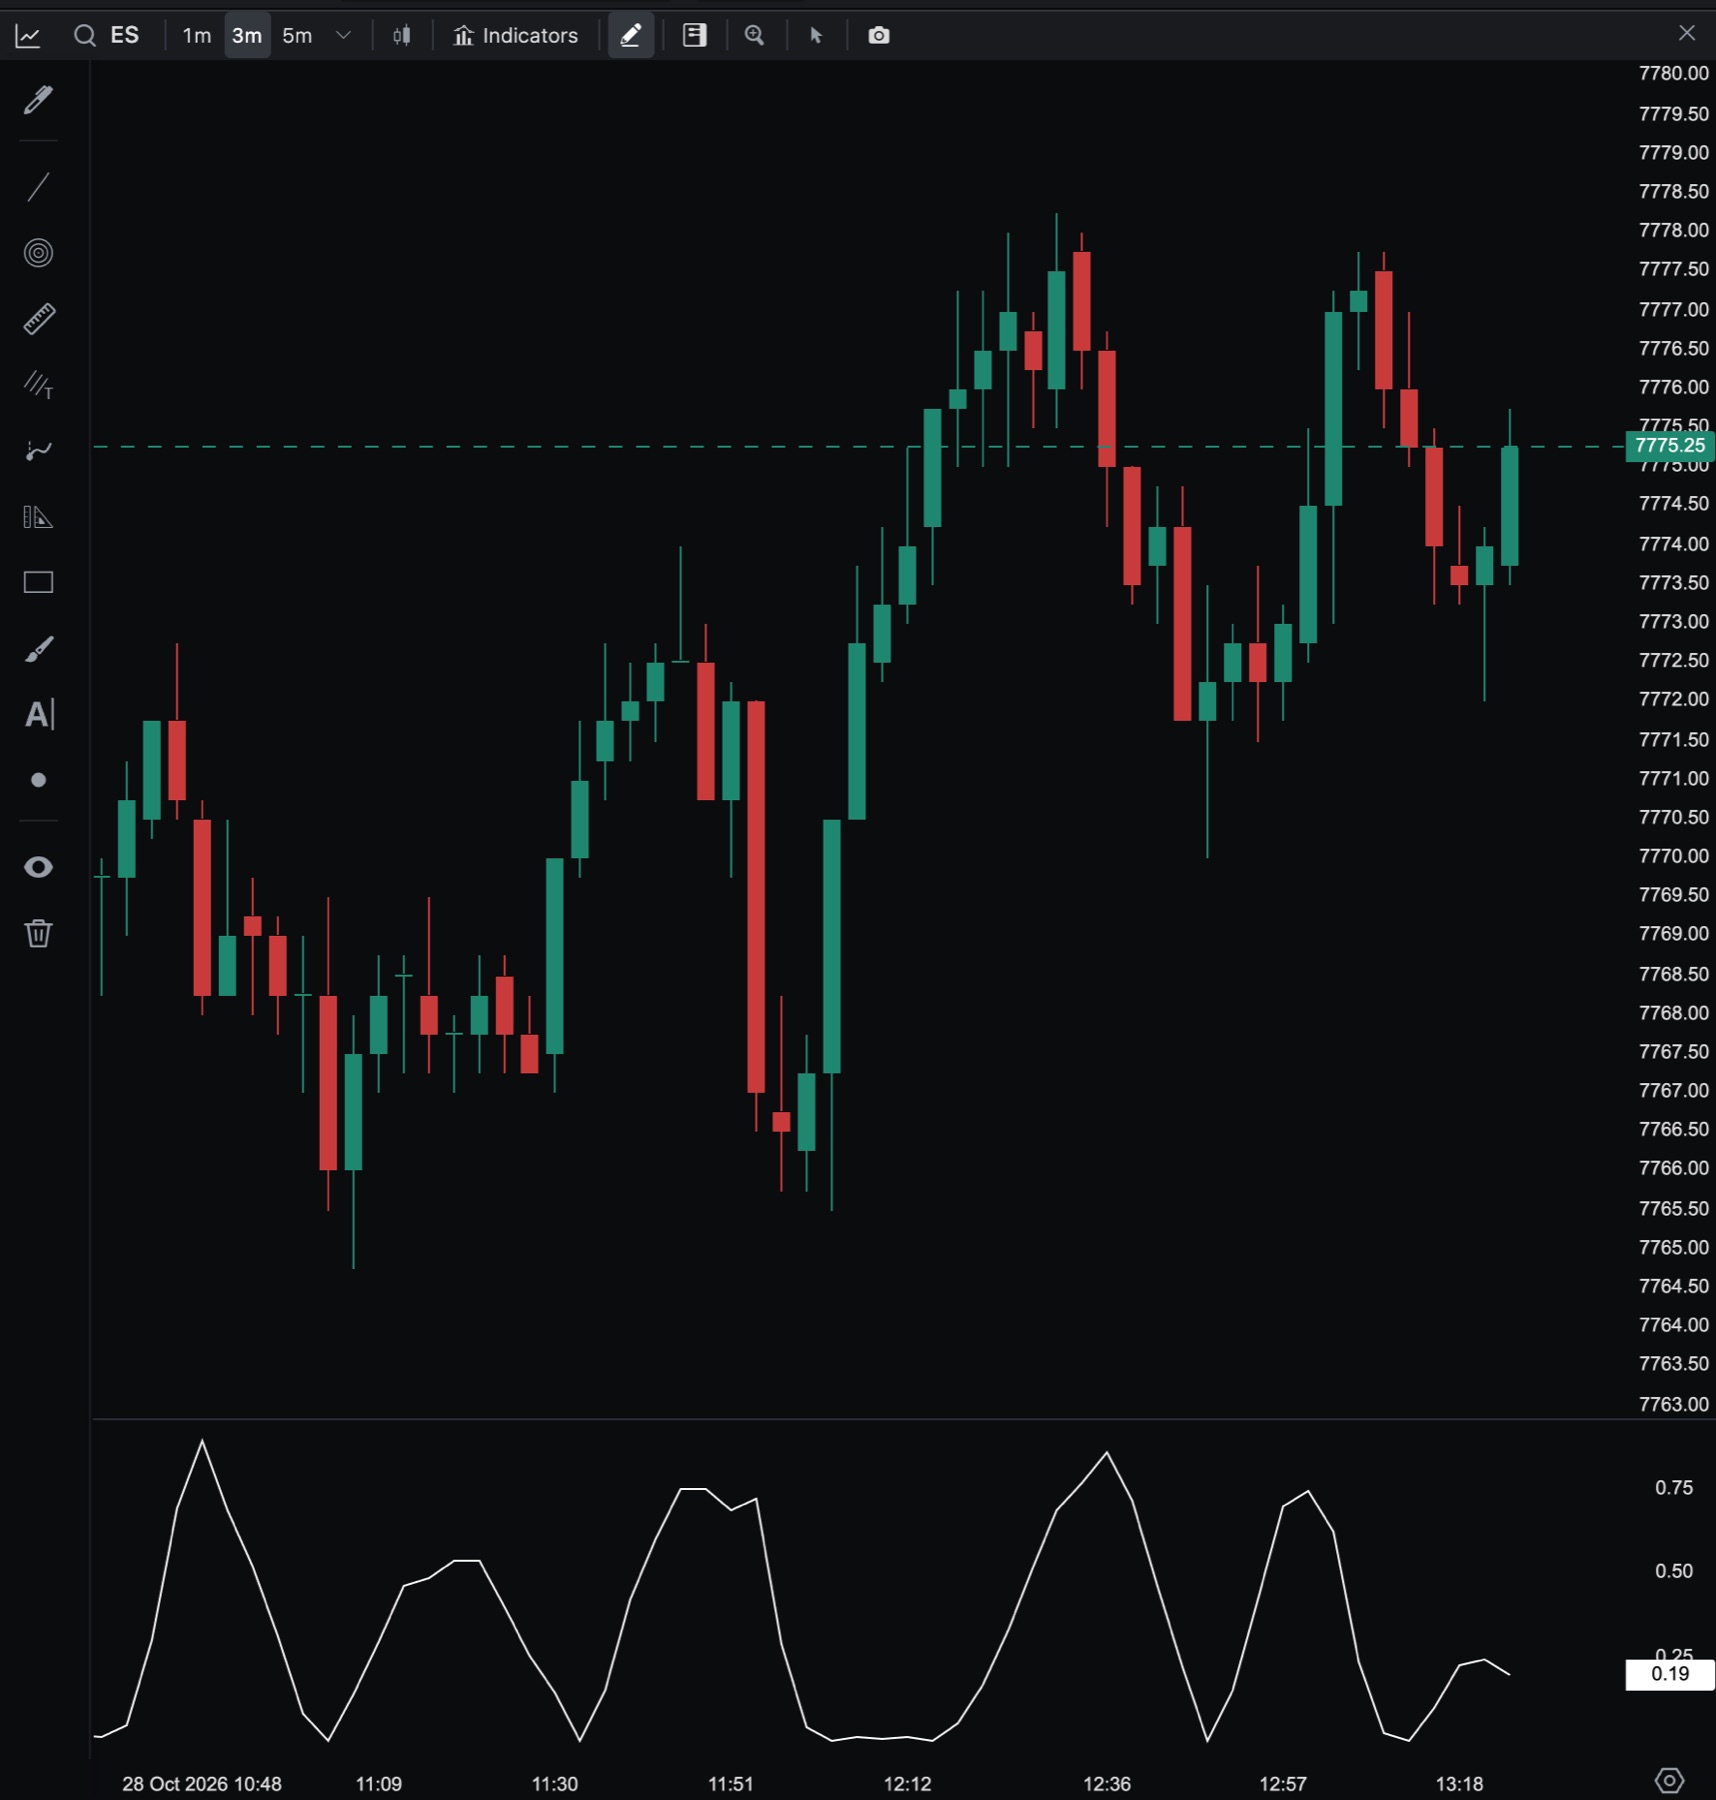
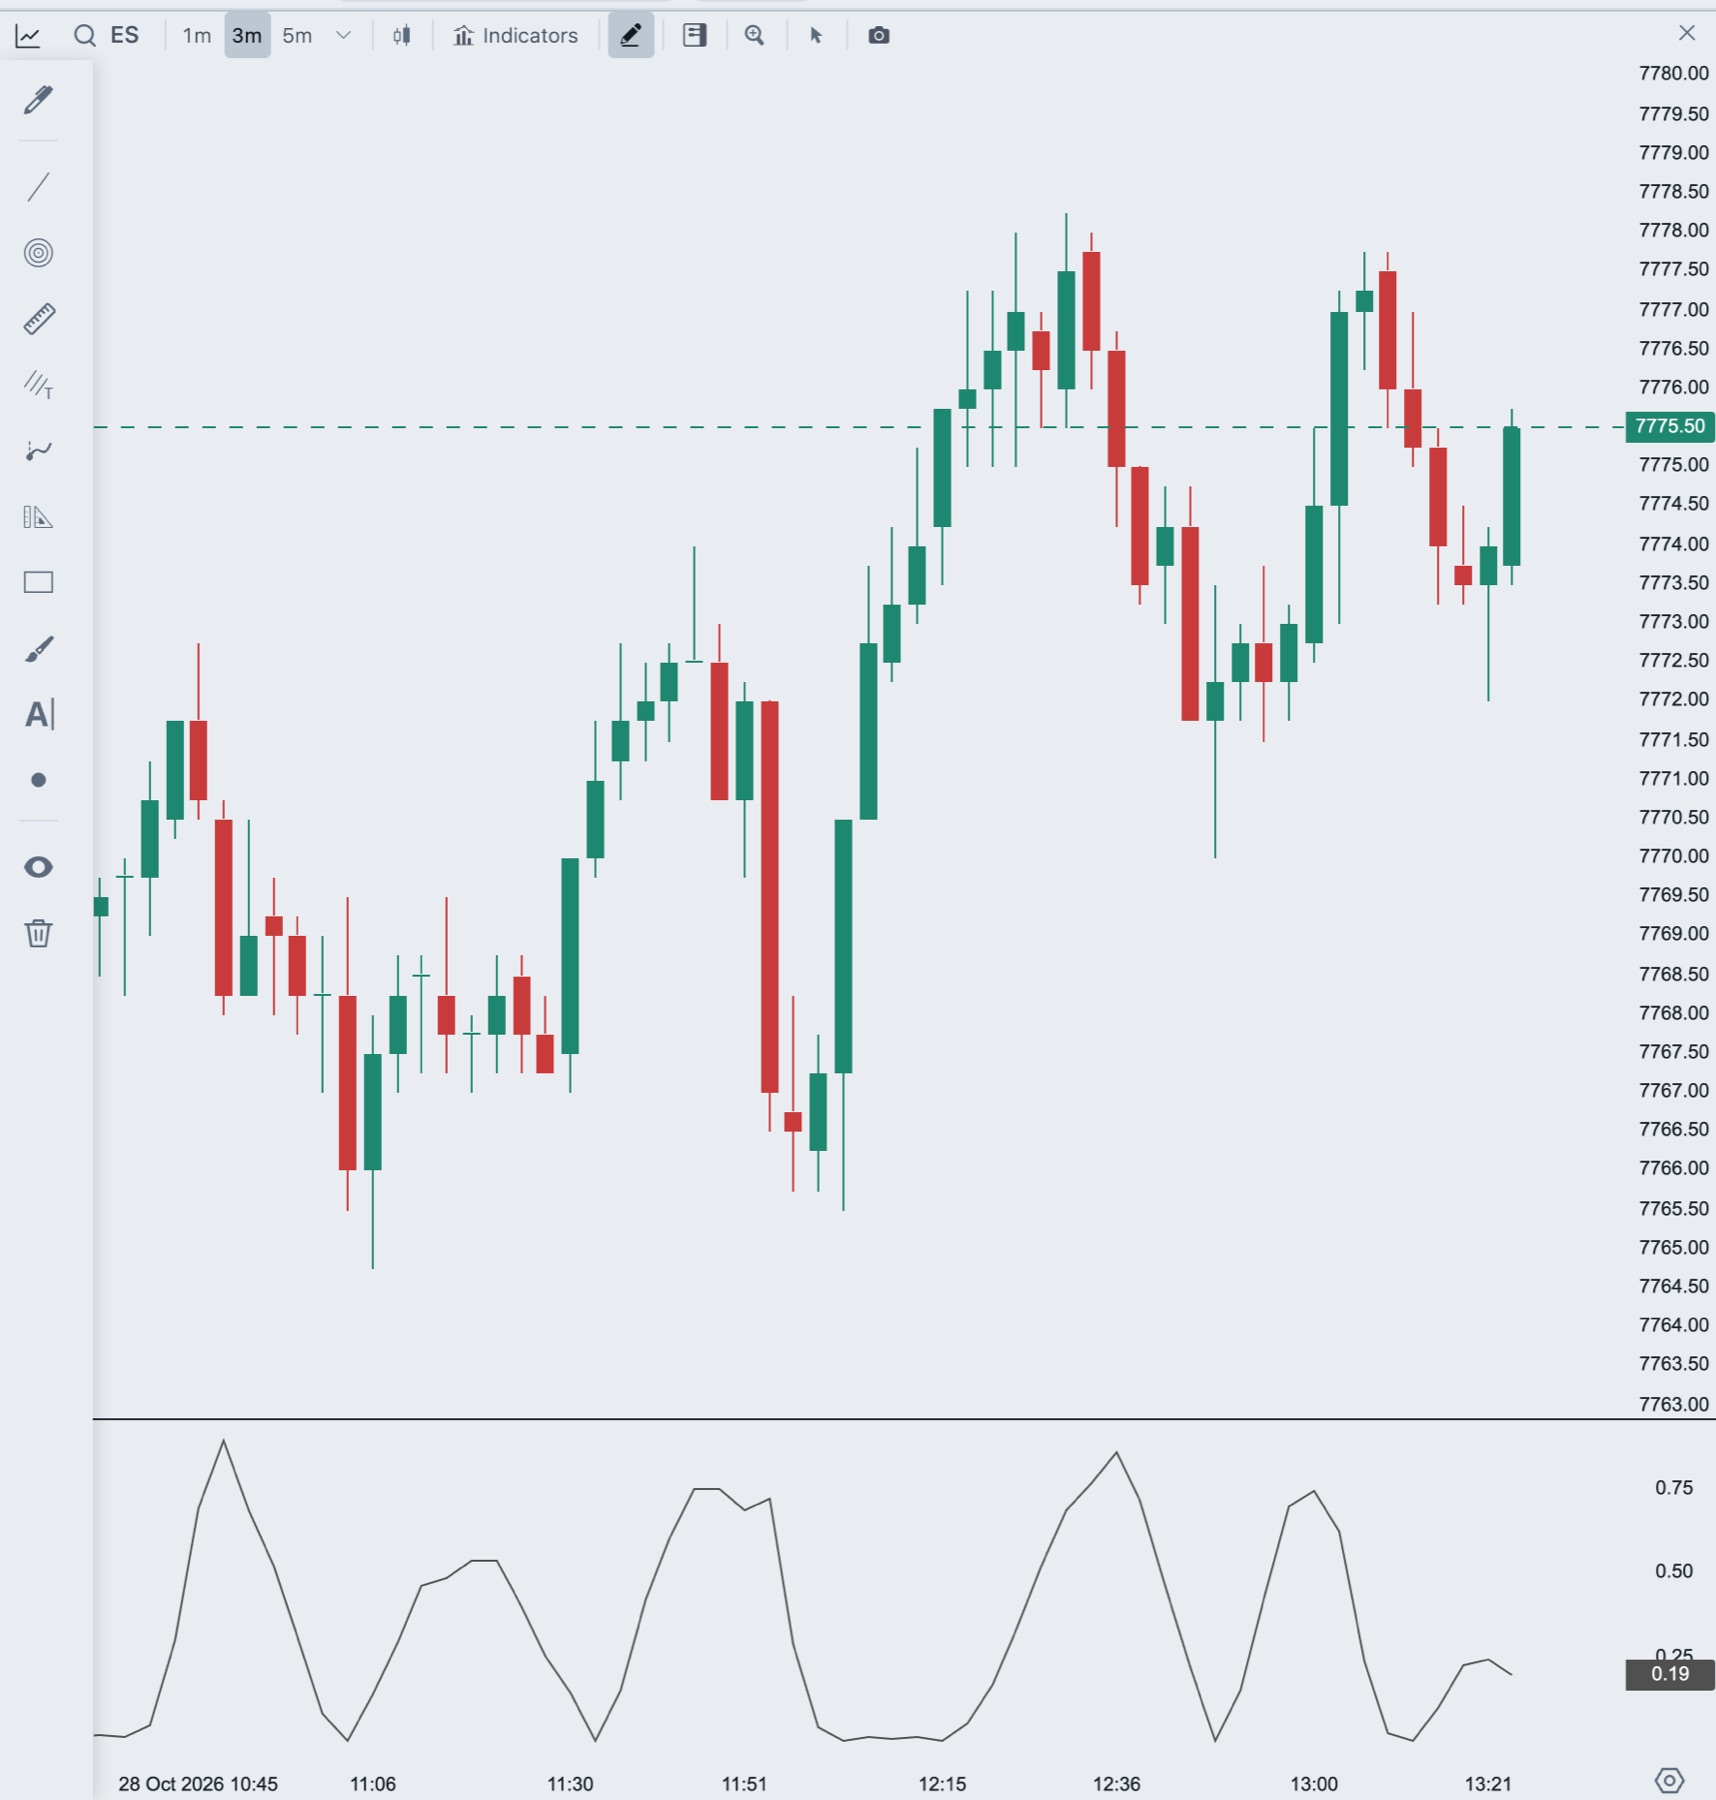
Linear regression fits the straightest line through the last N bars of price. The four indicators in the Regression group each report a different part of that line. They show where it ends, how steep it is, where it starts and how well price fits it.
- Shows
- A line on the price chart, or a line in its own panel
- Updates
- On every bar update, over the last N bars
- Best on
- Any time chart
How it is calculated
For the last Periods bars, the indicator finds the line that sits closest to the chosen price in a least-squares sense. That line has a slope and an intercept. The R2 value says how closely price follows the line.
When a new bar arrives, the window moves forward by one bar and the line is fitted again.
Add a regression indicator
- In the chart header, click Indicators.
- Under Add Indicator, open the Regression group, or type
LinearRegressionin Search indicators. - Click the name. It is added to the chart and its settings open on the right.
You can add the same indicator more than once, for example two slopes with different periods. See Add and manage indicators for hiding, reordering and removing indicators.
The indicators
The names below are the names in the indicator list. Each starts with a period of 14 bars and the close as its source.
| Name | What it shows | Draws |
|---|---|---|
| LinearRegressionForecast | The value the regression line projects for the current bar. It shows how far price has moved from where the trend line expects it. | Price chart |
| LinearRegression | The R2 value (coefficient of determination), from 0 to 1. A value near 1 means price follows a straight line closely. A value near 0 means there is no clear linear trend. | Own panel |
| LinearRegressionIntercept | The value of the regression line at the start of the window, where the bar number is zero. | Price chart |
| LinearRegressionSlope | The slope of the line, in price per bar. Above zero is an up trend. Below zero is a down trend. A larger number means a steeper trend. | Own panel |
The Oscillator group also has TSF (Time Series Forecast), CFO and FOSC. They use the same regression line.
Settings
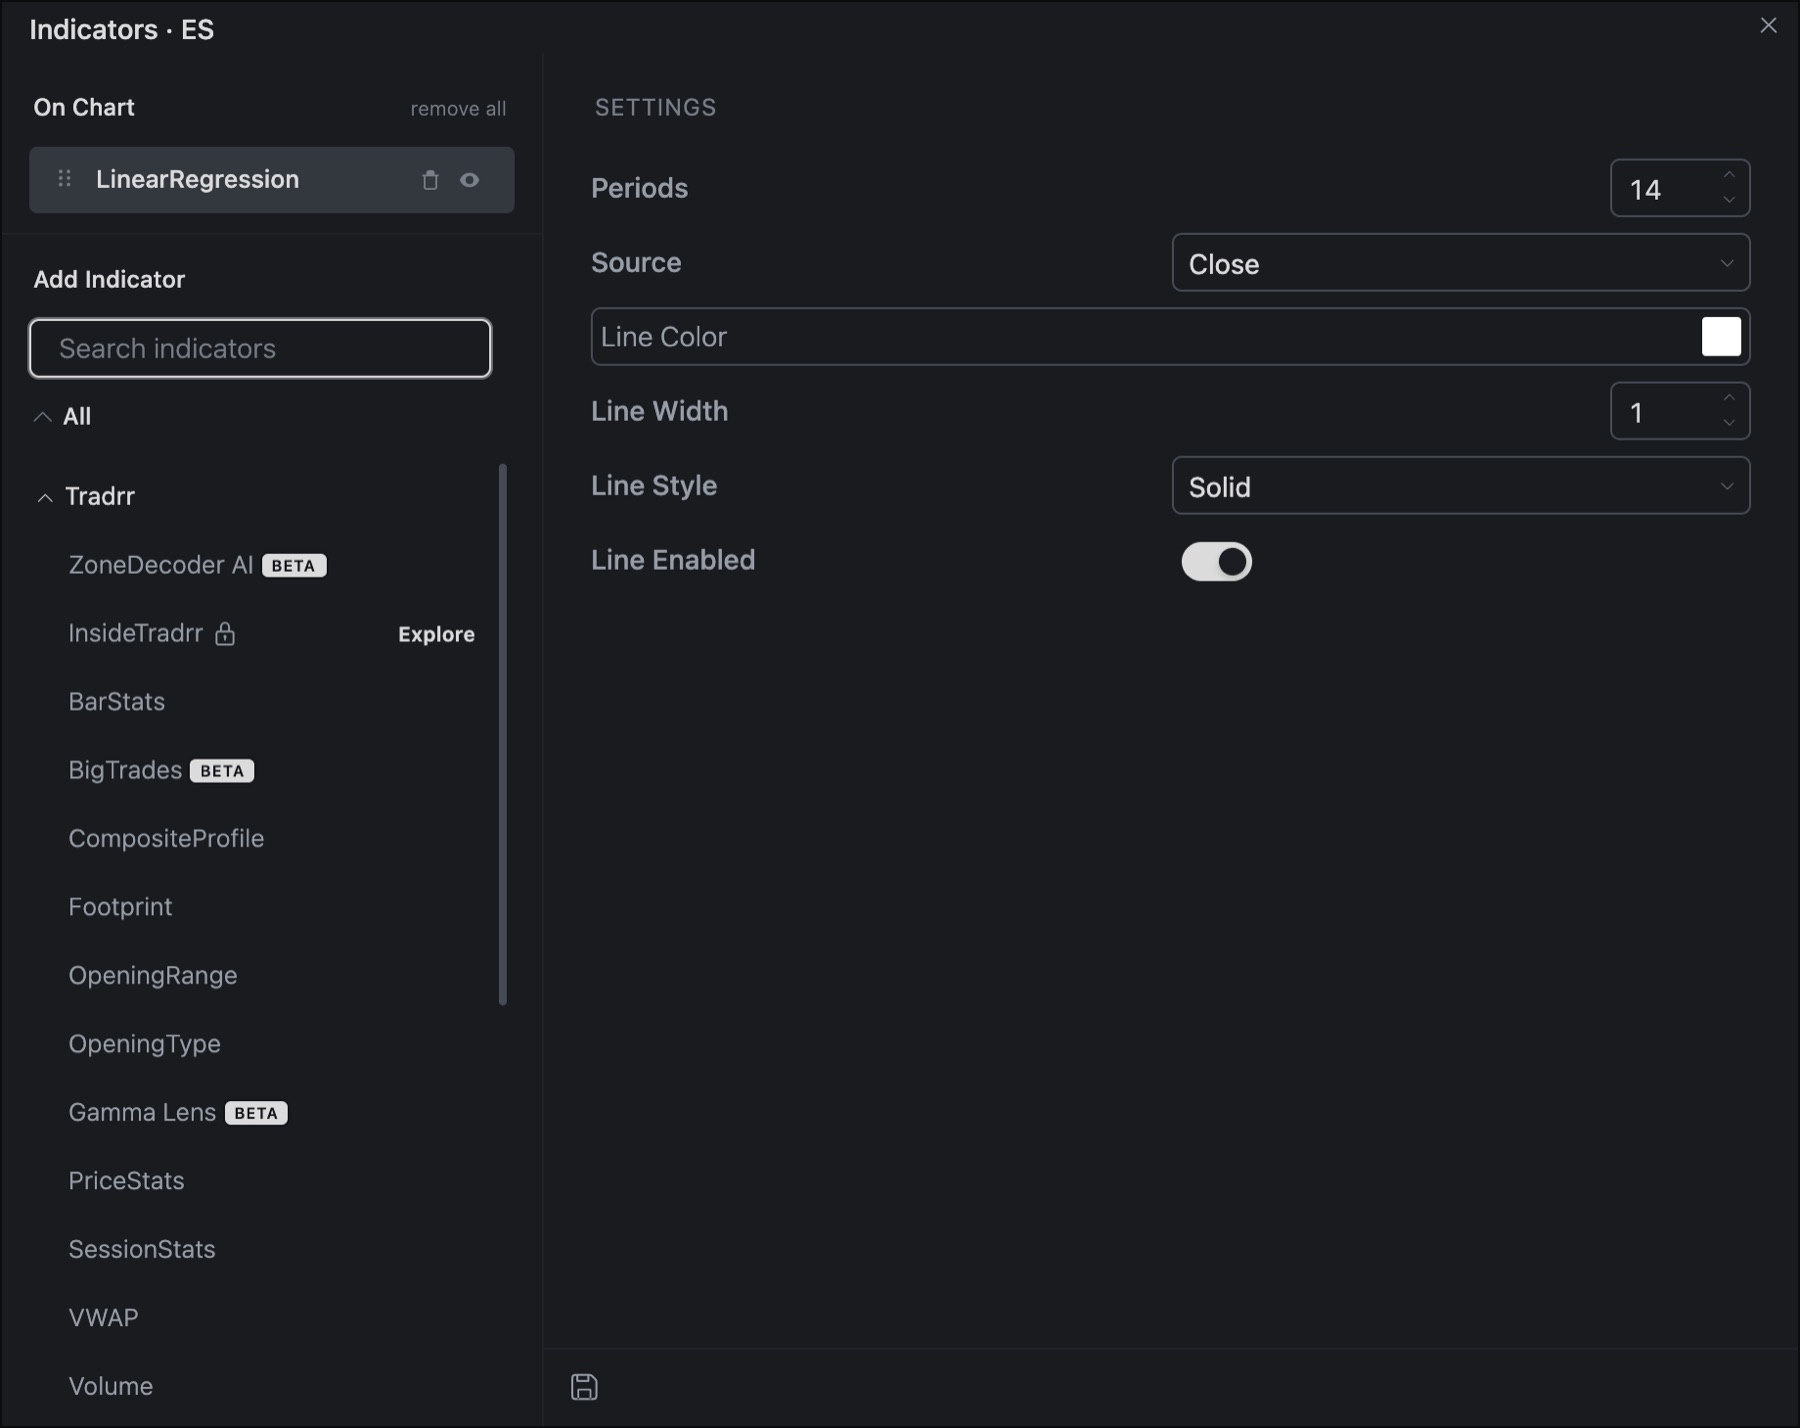
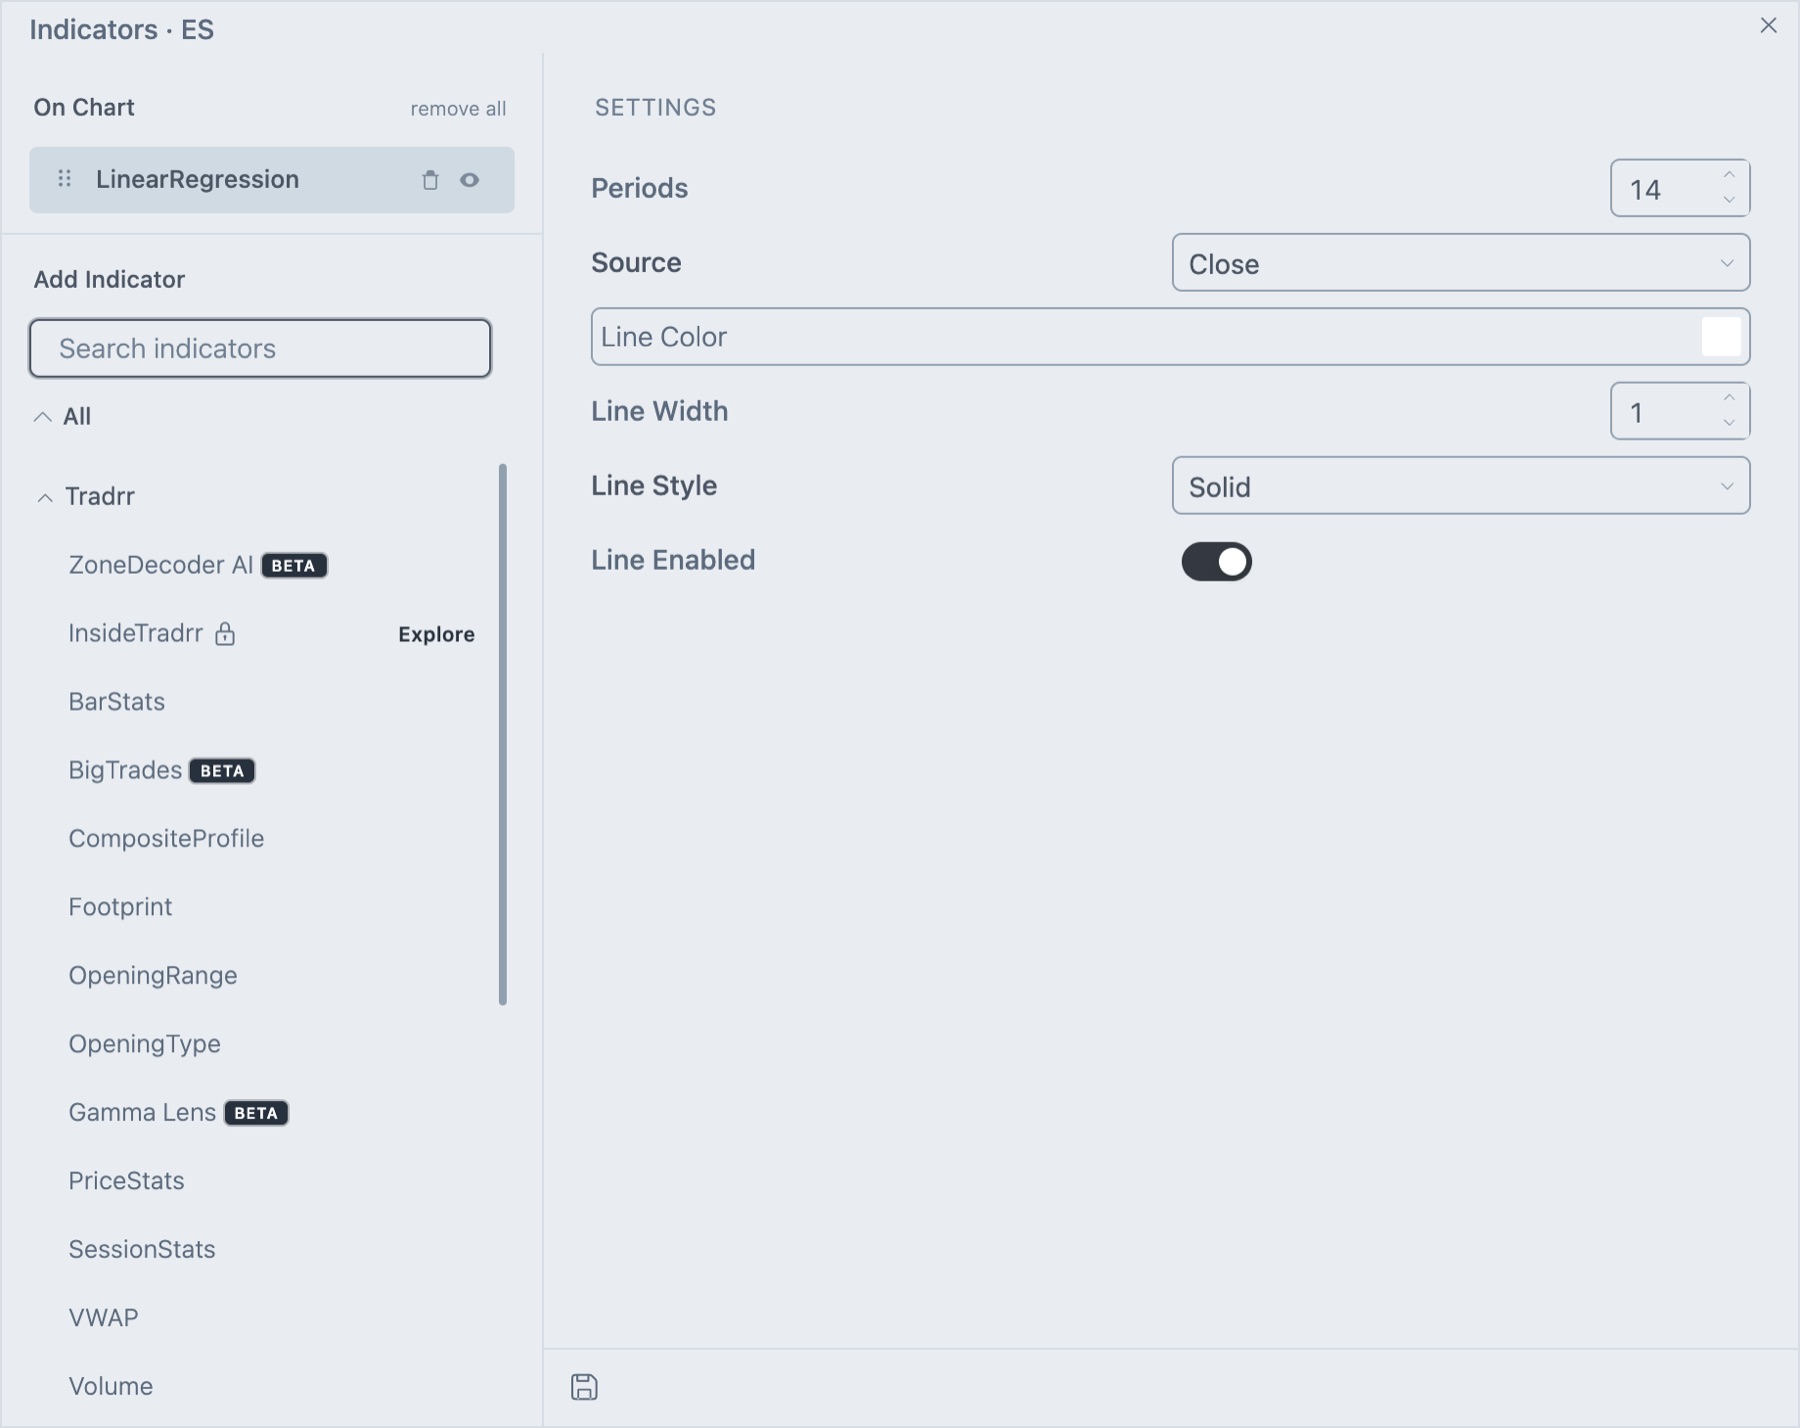
Each indicator opens a Settings group.
| Setting | What it does |
|---|---|
| Periods | How many bars the line is fitted to. The default is 14. Longer periods give a smoother, slower line. |
| Source | The price the line is fitted to: Open, High, Close, Volume, Weighted, Typical or Median. The default is Close. |
| Line Color | Color of the line. |
| Line Width | Thickness of the line. |
| Line Style | Solid, Dash, Dot or Dash-Dot. |
| Line Enabled | Switch that hides or shows the line. |
To start every new copy of an indicator with your settings, click the save icon at the bottom of the settings and choose Save as Default Template.
How traders read it
- Slope sign: positive slope means the fitted trend is up over that window, and negative means down.
- Slope getting smaller: the trend is flattening, even if price has not turned yet.
- R2 near 1: price is trending cleanly. Trend-following setups tend to suit this state.
- R2 near 0: price is choppy. Trend signals are less reliable.
- Forecast against price: price far above the forecast line means the last bars moved faster than the trend. Price far below it means the opposite.
Tip. Use R2 as a filter. Check the slope for direction only when R2 shows that the trend is clean.
Related articles
Was this article helpful?