ZoneDecoder AI Add-on
ZoneDecoder AI draws shaded price zones on your chart where price may react. Each zone carries a confidence percentage and the label ZD-AI. Traders use the zones as possible support and resistance when they plan entries, targets and scale-outs.
Beta. ZoneDecoder AI is in beta and is a paid add-on.
- Shows
- AI reaction zones with a confidence percentage
- Updates
- As the session develops
- Best on
- Intraday charts
What it measures
ZoneDecoder AI builds its zones from live volume and order flow. It looks at tick data, volume and the way trade is distributed across prices, and marks the areas where it expects a reaction.
- Zone: a shaded box between a low price and a high price. A zone that is still active extends to the right of the latest bar, so you can see it ahead of price.
- Confidence: a score the indicator gives each zone. It ranks how strongly the zone stands out. It is not a win rate.
- Stronger look: zones with a higher confidence are drawn with a stronger fill and a thicker border.
- Balanced zones: zones the indicator reads as balanced have a dashed border.
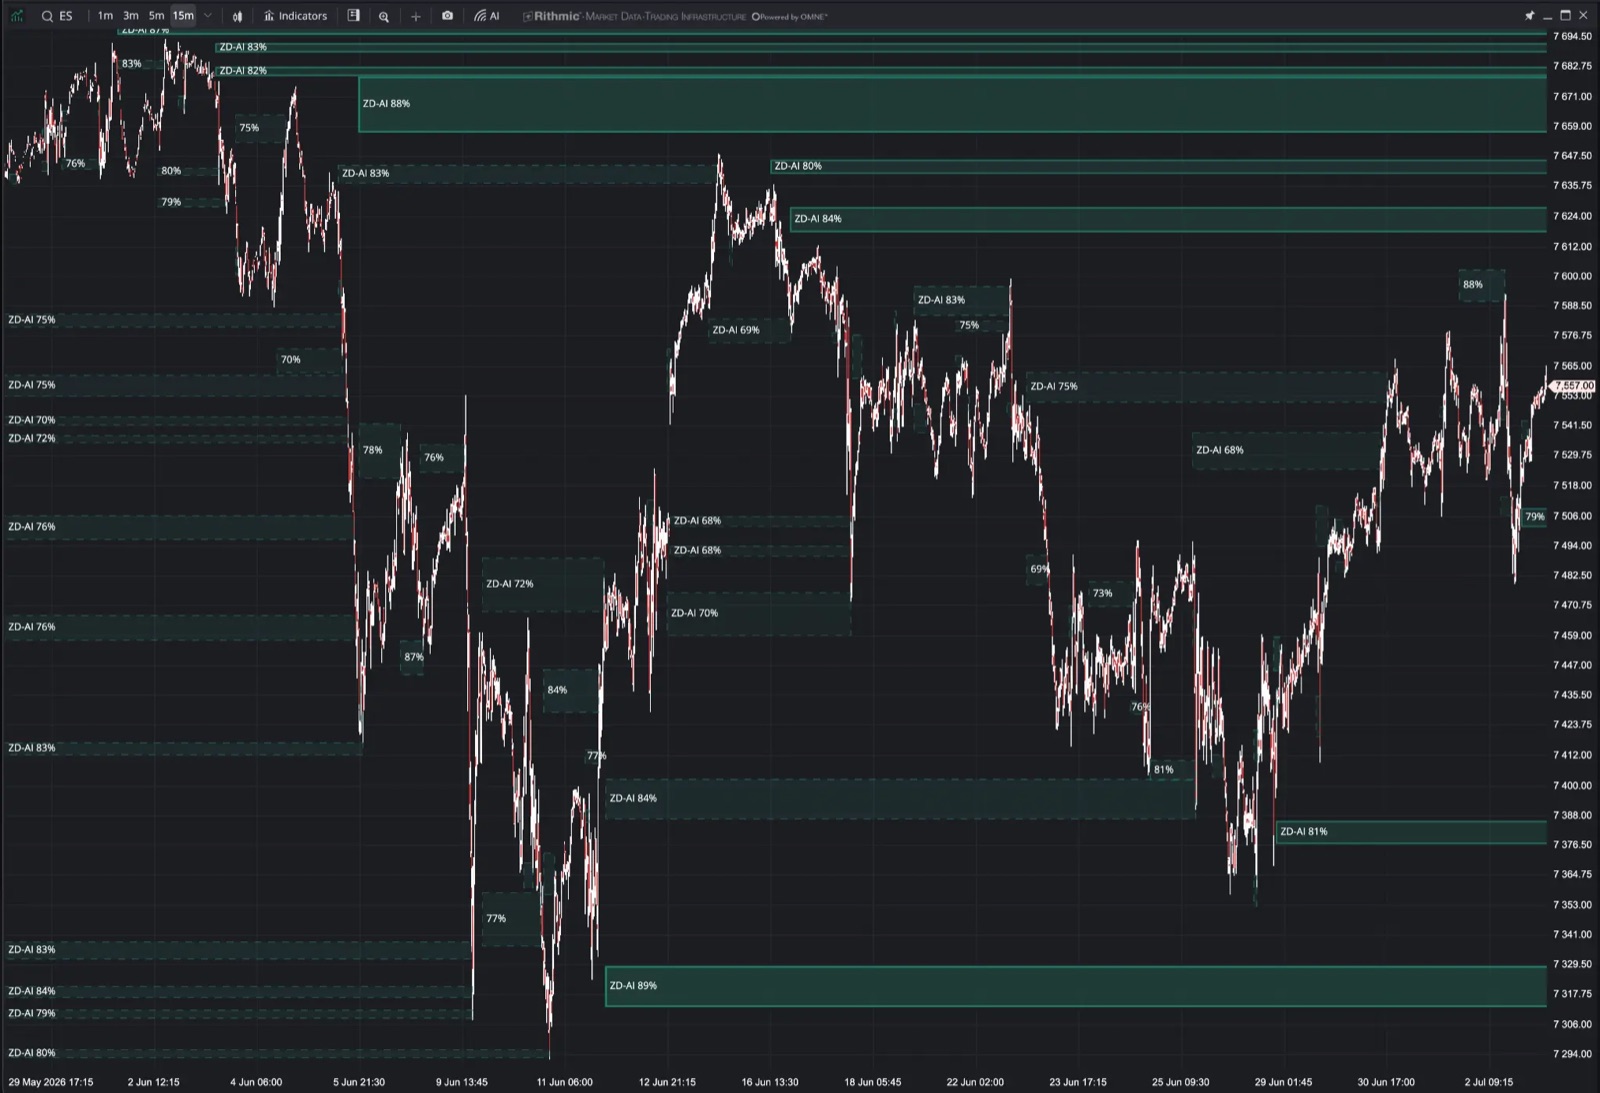
ZD-AI confidence labels. The zones here are green. New zones start light blue, and Zone Color changes them.Get access
ZoneDecoder AI is a paid add-on. In the indicator list it shows a lock and the label Upgrade until your account has access.
- In the top bar, click the Account button.
- In the products list, click ZoneDecoder AI. The row shows Active, Inactive or the days left in a trial.
- Read the panel, then click Unlock ZoneDecoder AI. Checkout continues with you already signed in.
- Finish checkout. When you return to the panel, click the button that starts with "I’ve subscribed" to check your access.
- When the panel says Your access is active, close it.
You can also click ZoneDecoder AI in the indicator list while it is locked. That opens the same panel. For plans, trials and billing, see ZoneDecoder AI add-on and Plans and free trial.
Add ZoneDecoder AI to a chart
- In the chart header, click Indicators.
- Under Add Indicator, type
ZoneDecoderin Search indicators, or open the Tradrr group. - Click ZoneDecoder AI, which carries a BETA tag. It is added to the chart and its settings open on the right.
If the indicator is not available, open the Account panel and check that ZoneDecoder AI is Active.
Settings
General
| Setting | What it does | Default |
|---|---|---|
| AI confidence | Shows the label on each zone, such as ZD-AI 78%. When a zone is too narrow for the full label, the label shows only the percentage. | On |
| Label Offset | Distance of the label from the left edge of the zone, in px or %. | 4 px |
Zones
| Setting | What it does | Default |
|---|---|---|
| Zone Color | Color of the zones. Fill and border strength still follow confidence. | Light blue |
| Forward Extension, px | How far a zone extends to the right of the latest bar, in pixels. | 150 |
Font
| Setting | What it does | Default |
|---|---|---|
| Color swatch | Color of the label text. | Light grey |
| Font family | Open Sans, Monospace or Sans Serif. | Open Sans |
| Font weight | Regular or Bold. | Bold |
| Font size | Size of the label text. | 10 |
How traders read it
- Zones above price: possible resistance. Traders look for a reaction, a rejection or a break, and plan targets and scale-outs around them.
- Zones below price: possible support, used the same way.
- Higher confidence: the indicator rates the zone as stronger. Compare zones with each other, not with a win rate.
- Price inside a zone: the market is at a level where the indicator expects a reaction. Wait for the reaction before you act.
Tip. Pair the zones with the Volume Profile. A zone that sits near a point of control or a value area edge has two reasons to matter.
Related articles
Was this article helpful?