Moving averages
A moving average smooths price into a single line so the direction of the trend is easier to see. Tradrr has 15 indicators in the Moving Average group of the indicator list. They differ in how they weight recent prices and how fast they react.
- Shows
- A smoothed line over price, or an envelope around it
- Updates
- On every bar update
- Best on
- Any time chart
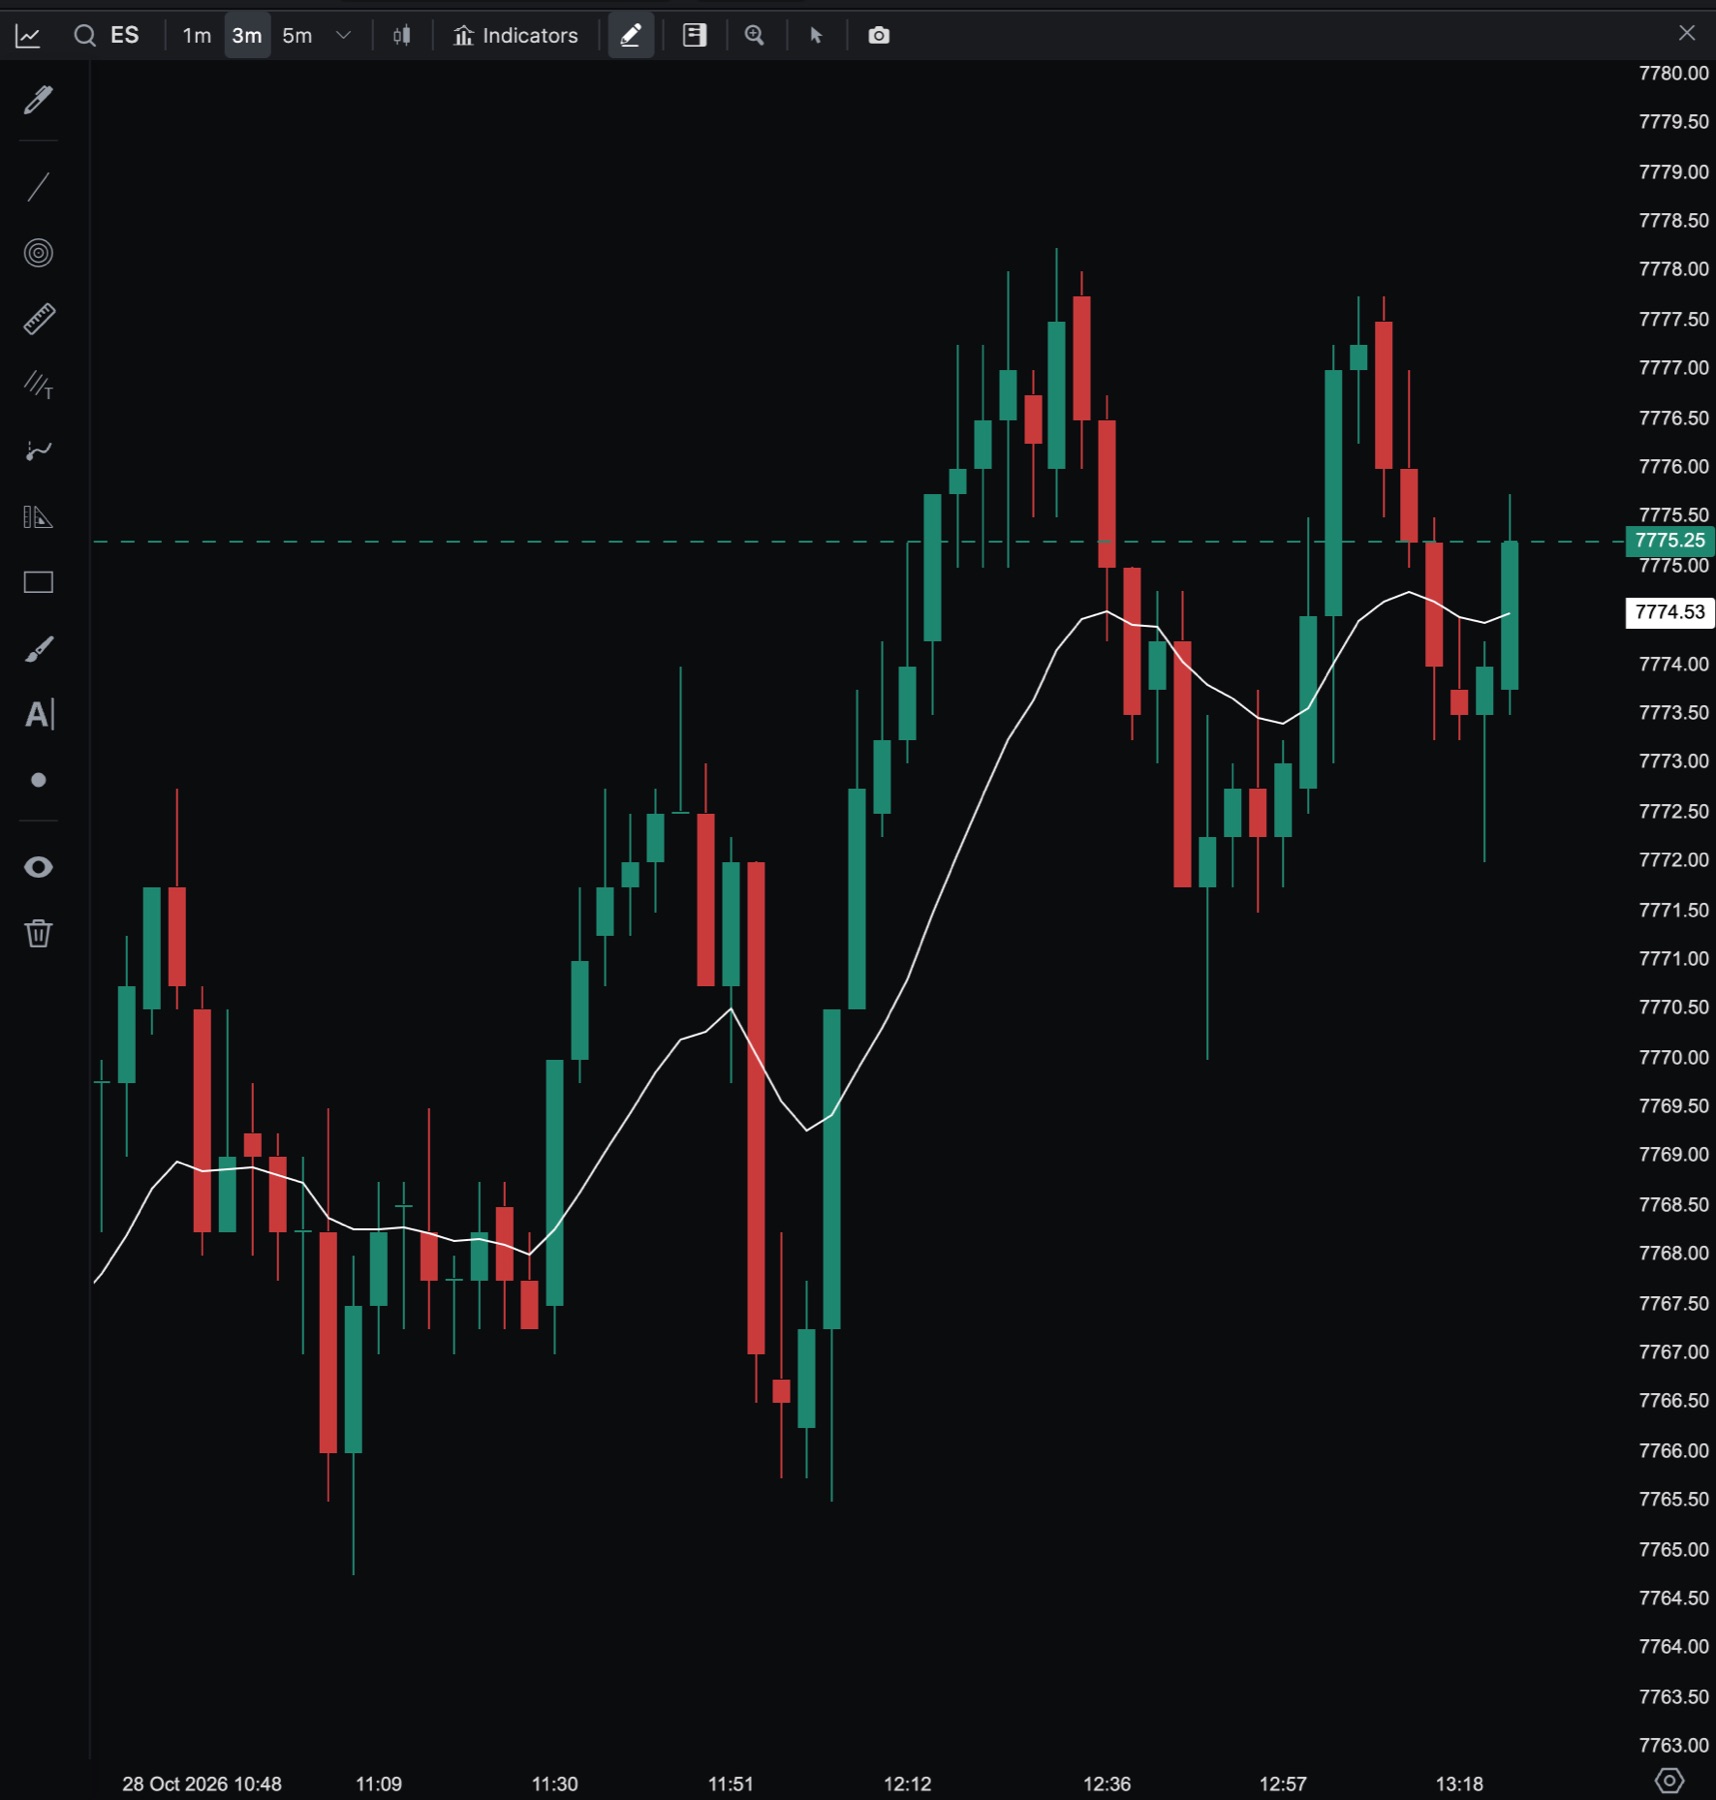
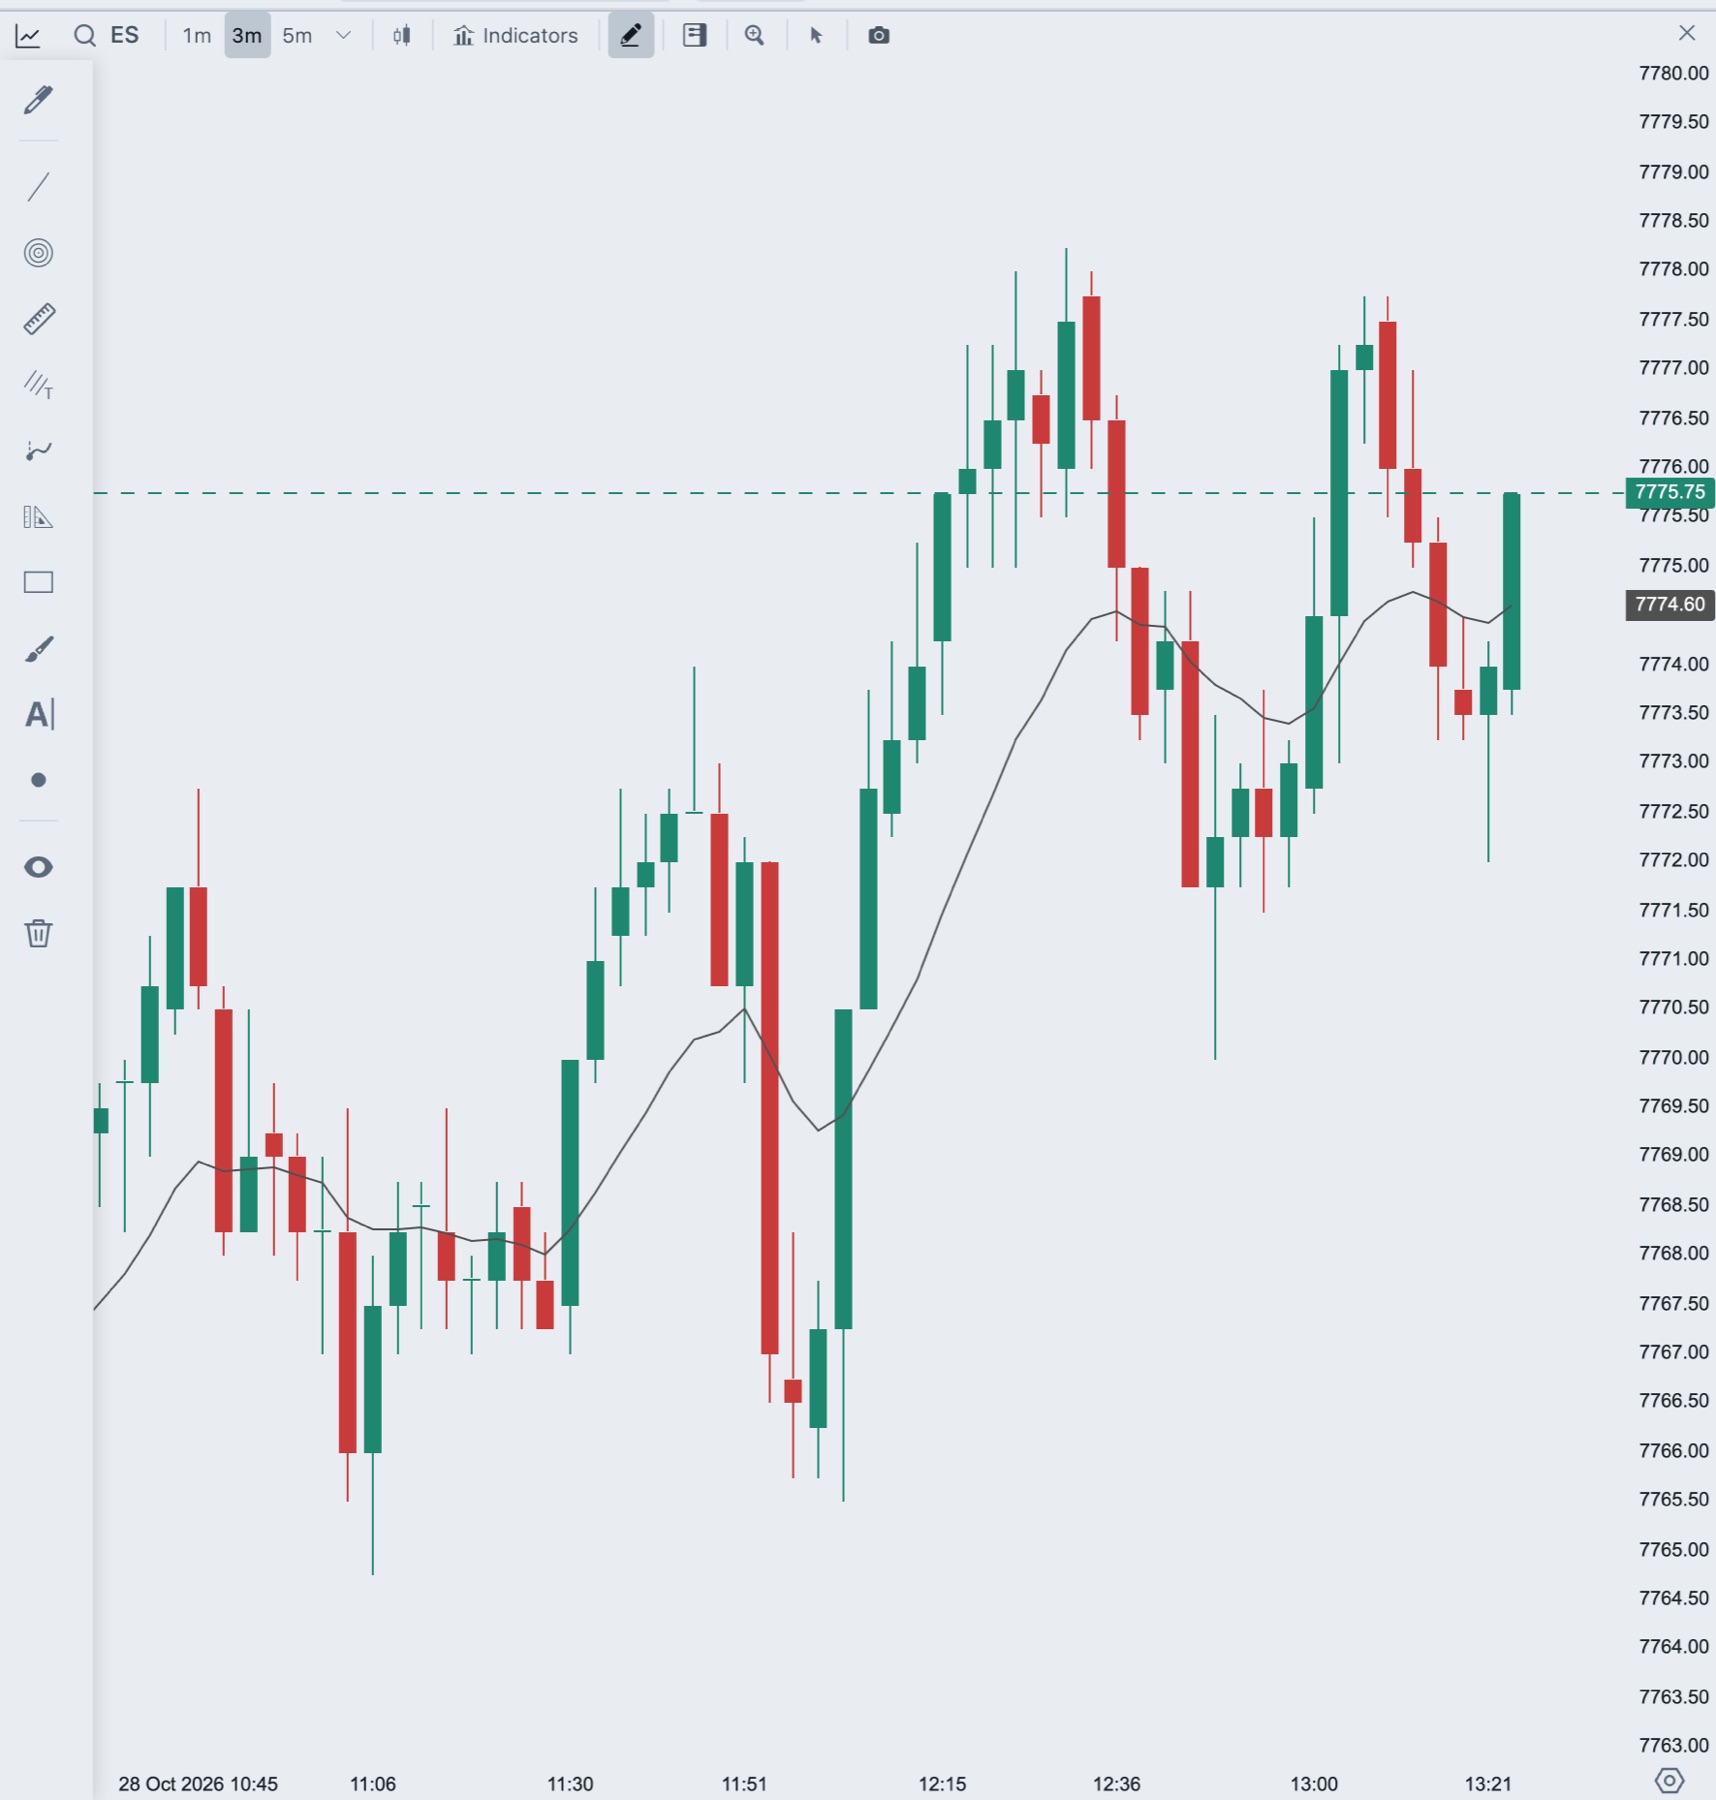
Add a moving average
- In the chart header, click Indicators.
- Under Add Indicator, open the Moving Average group, or type the name, for example
EMA, in Search indicators. - Click the name. It is added to the chart and its settings open on the right.
You can add the same indicator more than once, for example a fast and a slow EMA. The second copy is named EMA (2). See Add and manage indicators for hiding, reordering and removing indicators.
The indicators
The names below are the names in the indicator list. The default period is the value a new indicator starts with.
| Name | What it is | Default period | Draws |
|---|---|---|---|
| DeviationToMA | How far the close is from its moving average, relative to that average. Large values mean prices are spread out around the average. | 14 | Own panel |
| MAEnvelopes | A moving average with an upper and a lower line a fixed percentage away from it. The percentage starts at 1.5. | 14 | Price chart |
| VMA | Variable Moving Average. An exponential average that adjusts its smoothing to market volatility. | 9 | Price chart |
| TMA | Triangular Moving Average. A simple average that is averaged a second time for a smoother line. | 15 | Price chart |
| EMA | Exponential Moving Average. Gives more weight to recent prices. | 14 | Price chart |
| KAMA | Kaufman's Adaptive Moving Average. Adjusts to market noise. | 14 | Own panel |
| HMA | Hull Moving Average. A fast, smooth average that reduces lag. | 14 | Price chart |
| VOLMA | Volume Moving Average. A moving average of volume instead of price. | 14 | Own panel |
| DEMA | Double Exponential Moving Average. Reacts faster than an EMA of the same period. | 14 | Price chart |
| TEMA | Triple Exponential Moving Average. Built to cut the lag of an EMA further. | 14 | Price chart |
| SMA | Simple Moving Average. The plain average of the last N values. | 14 | Price chart |
| WWS | Welles Wilder Smoothing. Similar to an EMA but slower to react to change. | 14 | Price chart |
| VIDYA | Volatility Index Dynamic Average. Adapts its smoothing using a linear regression fit. | 14 | Price chart |
| WMA | Weighted Moving Average. Gives more weight to the most recent data points. | 14 | Price chart |
| ZLEMA | Zero Lag Exponential Moving Average. An EMA that compensates for lag. | 14 | Price chart |
Settings
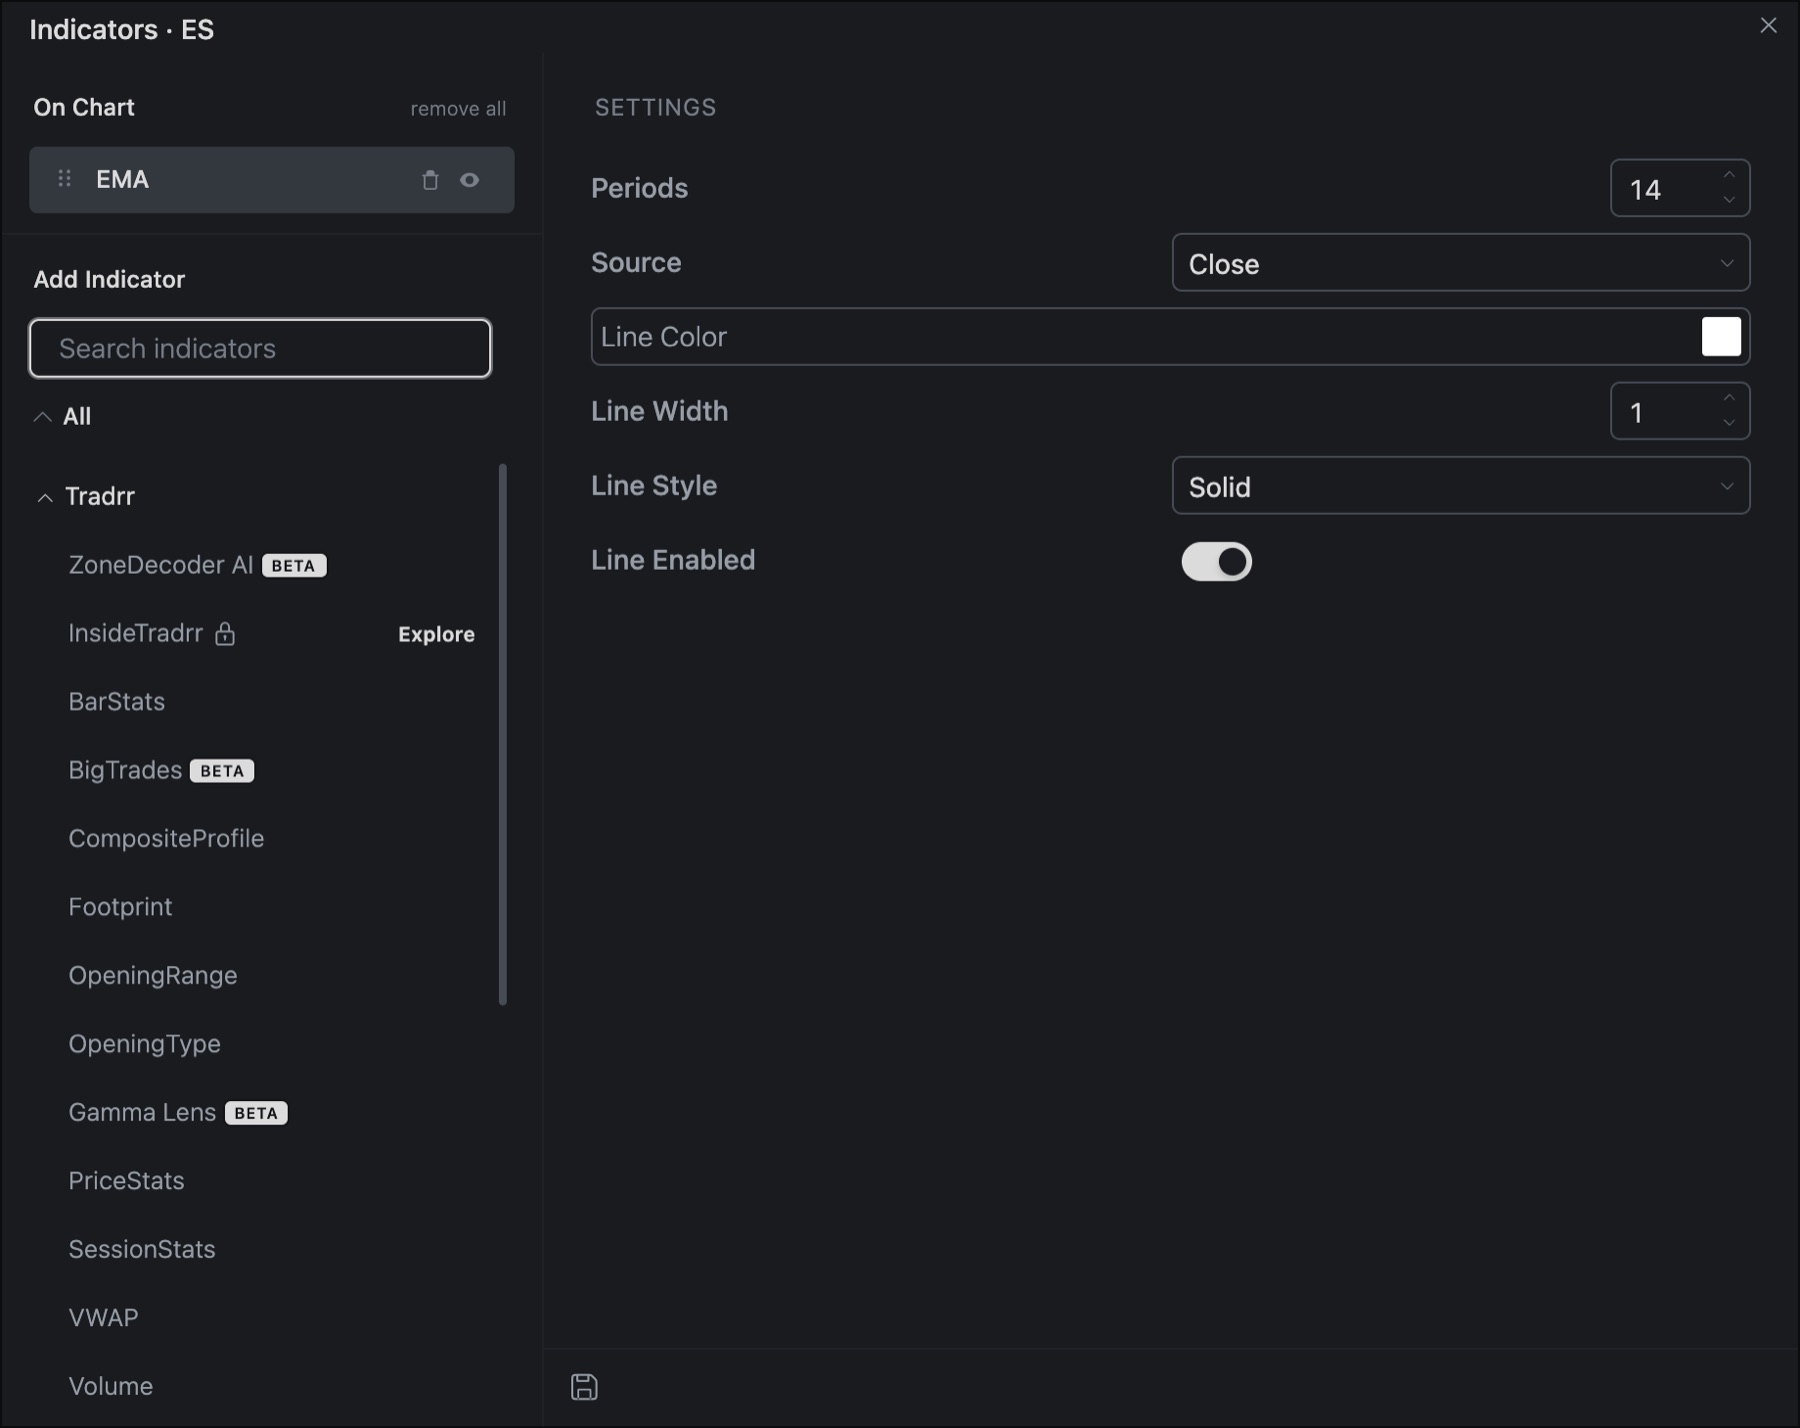
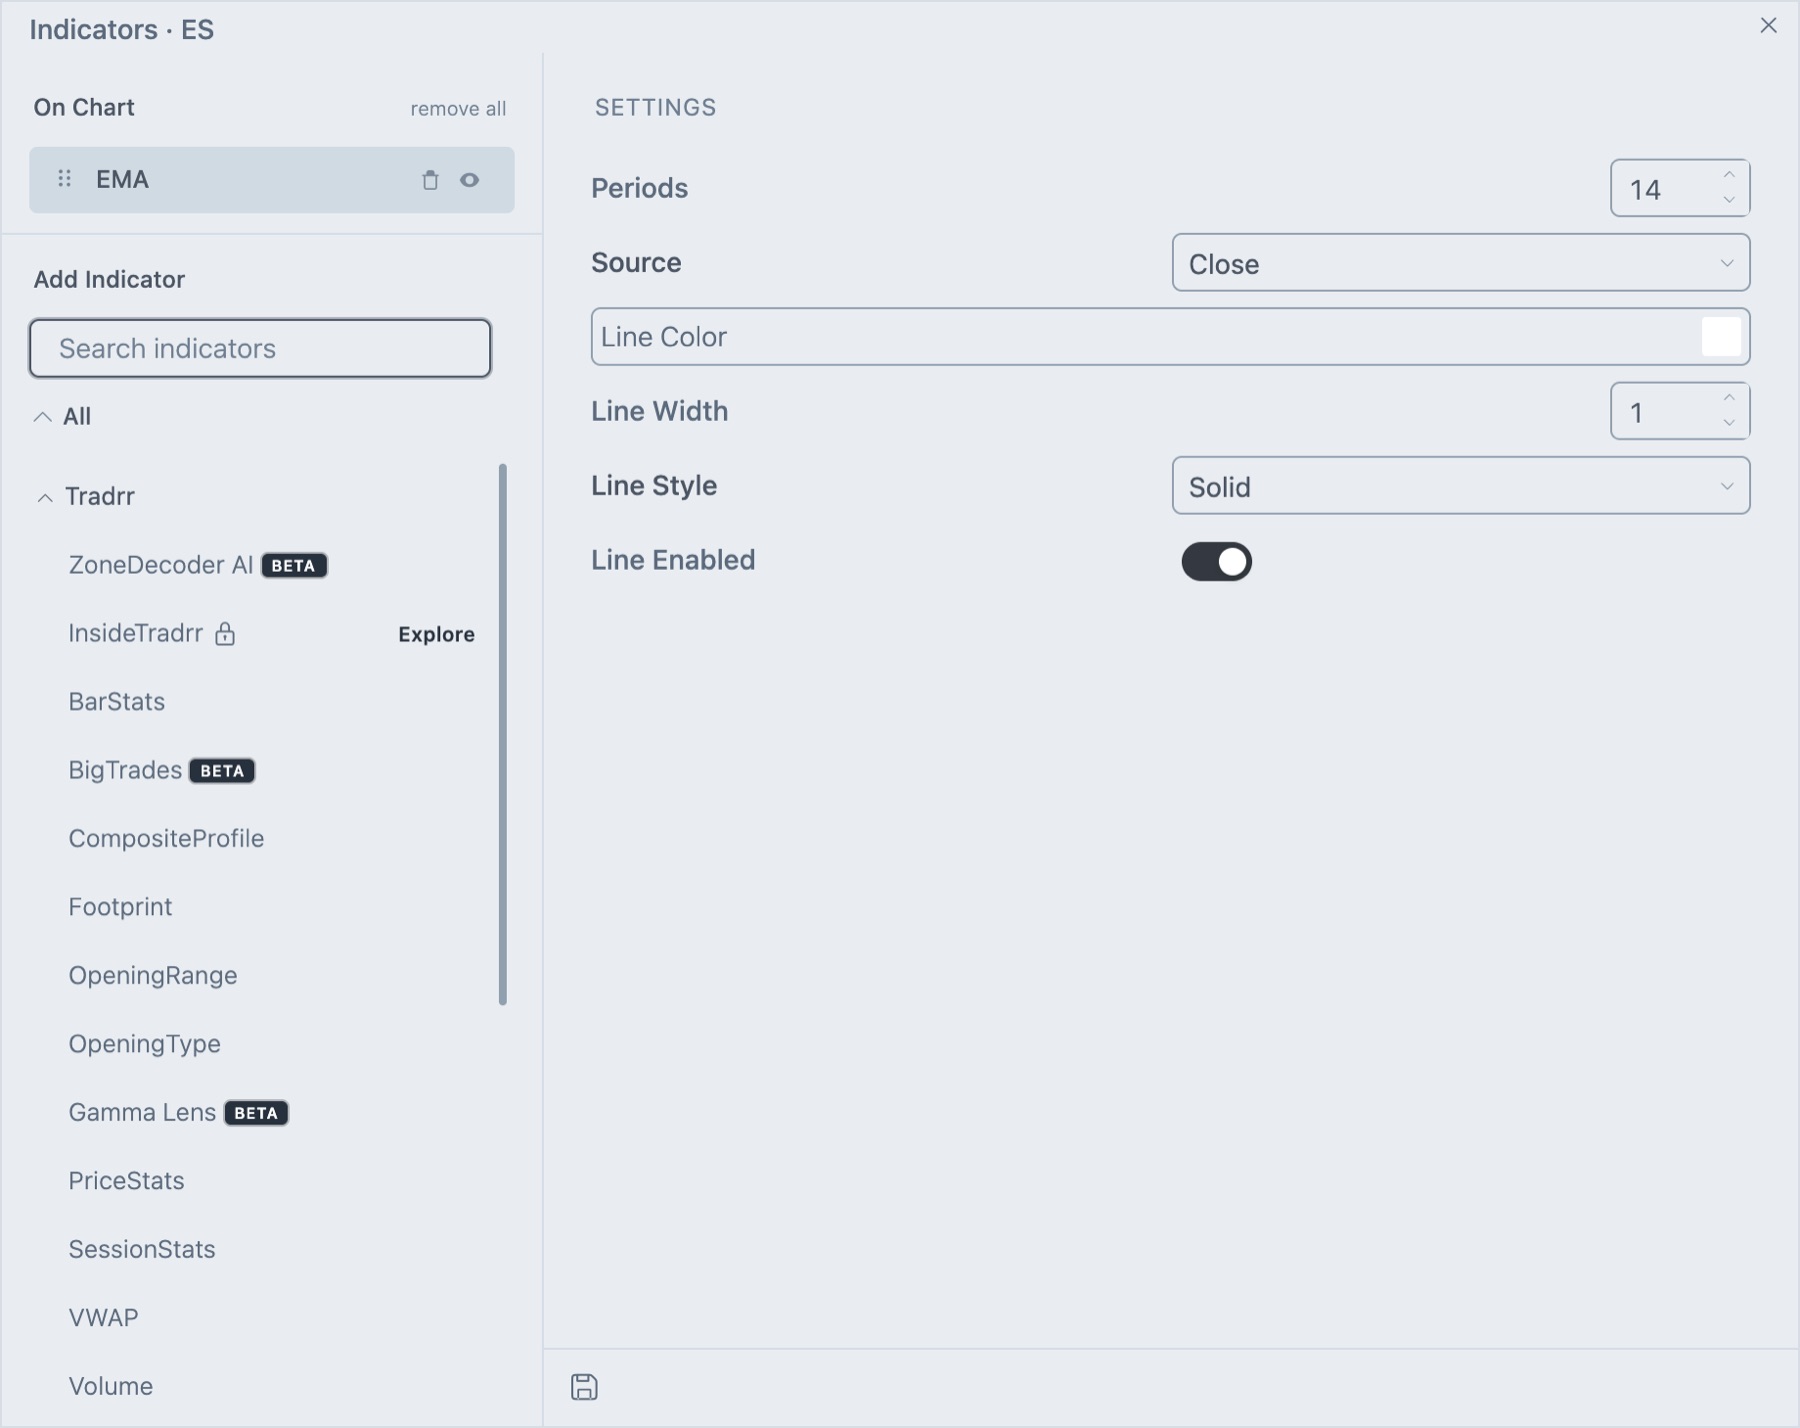
Each indicator opens a Settings group with the fields that apply to it. The EMA shown above has these, in this order:
| Setting | What it does |
|---|---|
| Periods | How many bars the average uses. Shorter periods react faster and are noisier. |
| Source | The price the average is built from: Open, High, Close, Volume, Weighted, Typical or Median. Most moving averages start on Close. DeviationToMA, VOLMA and a few others have no Source. |
| Line Color | Color of the line. |
| Line Width | Thickness of the line. |
| Line Style | Solid, Dash, Dot or Dash-Dot. |
| Line Enabled | Switch to hide or show a line. Indicators with several lines, such as MAEnvelopes, have one switch, color, width and style per line. |
Some indicators add their own fields. KAMA has Fast (25) and Slow (40). VMA has Volatility Period (9). VIDYA has R2 Scale (0.65). MAEnvelopes has Envelope Percentage and Moving Average Type, a number that picks the average it wraps: 0 EMA, 1 HMA, 2 SMA, 3 TMA, 4 TEMA, 5 WMA, 6 VMA, 7 WWS or 8 VIDYA. It starts on 2, the SMA. To start every new copy of an indicator with your settings, click the save icon at the bottom of the settings and choose Save as Default Template. Reset Default Template brings the standard settings back.
How traders read them
- Price above the average: the trend is up over that period. Price below it points down.
- Slope: a rising line shows upward momentum. A flat line shows a range.
- Crossovers: when a fast average crosses a slow one, the short-term trend has turned against the longer one. Crossovers lag, so many traders use them to confirm a move rather than to enter it.
- Pullbacks: in a strong trend, price often returns to a rising average before it continues.
Tip. A shorter period or a faster type such as HMA, DEMA or TEMA reacts sooner but gives more false turns. Pick one setup and test it on Market Replay before you trade with it.
Related articles
Was this article helpful?