VWAP
VWAP (volume-weighted average price) is the average price of the session, weighted by volume. Many traders use it as the fair value line for the day.
- Shows
- A 24H VWAP and an RTH VWAP, with optional bands
- Resets
- 24H: at the daily session open. RTH: at its Start Time
- Best on
- Intraday time charts
How it is calculated
For each bar, VWAP takes the typical price, which is the average of the high, low and close. It multiplies that price by the bar's volume and adds the result to a running total. VWAP divides the running total by the total volume.
While a bar is still forming, each new block of volume is priced at the last traded price. Large-volume bars move VWAP more than small ones, so VWAP can stay flat during a fast move on thin volume.
- 24H VWAP counts every bar of the trading day, overnight included. It starts again at the next daily session open, 6:00 PM New York time.
- RTH VWAP counts only bars between its Start Time and End Time, and starts again each day at the Start Time. The defaults are 09:30 to 16:00 New York time.
On the chart
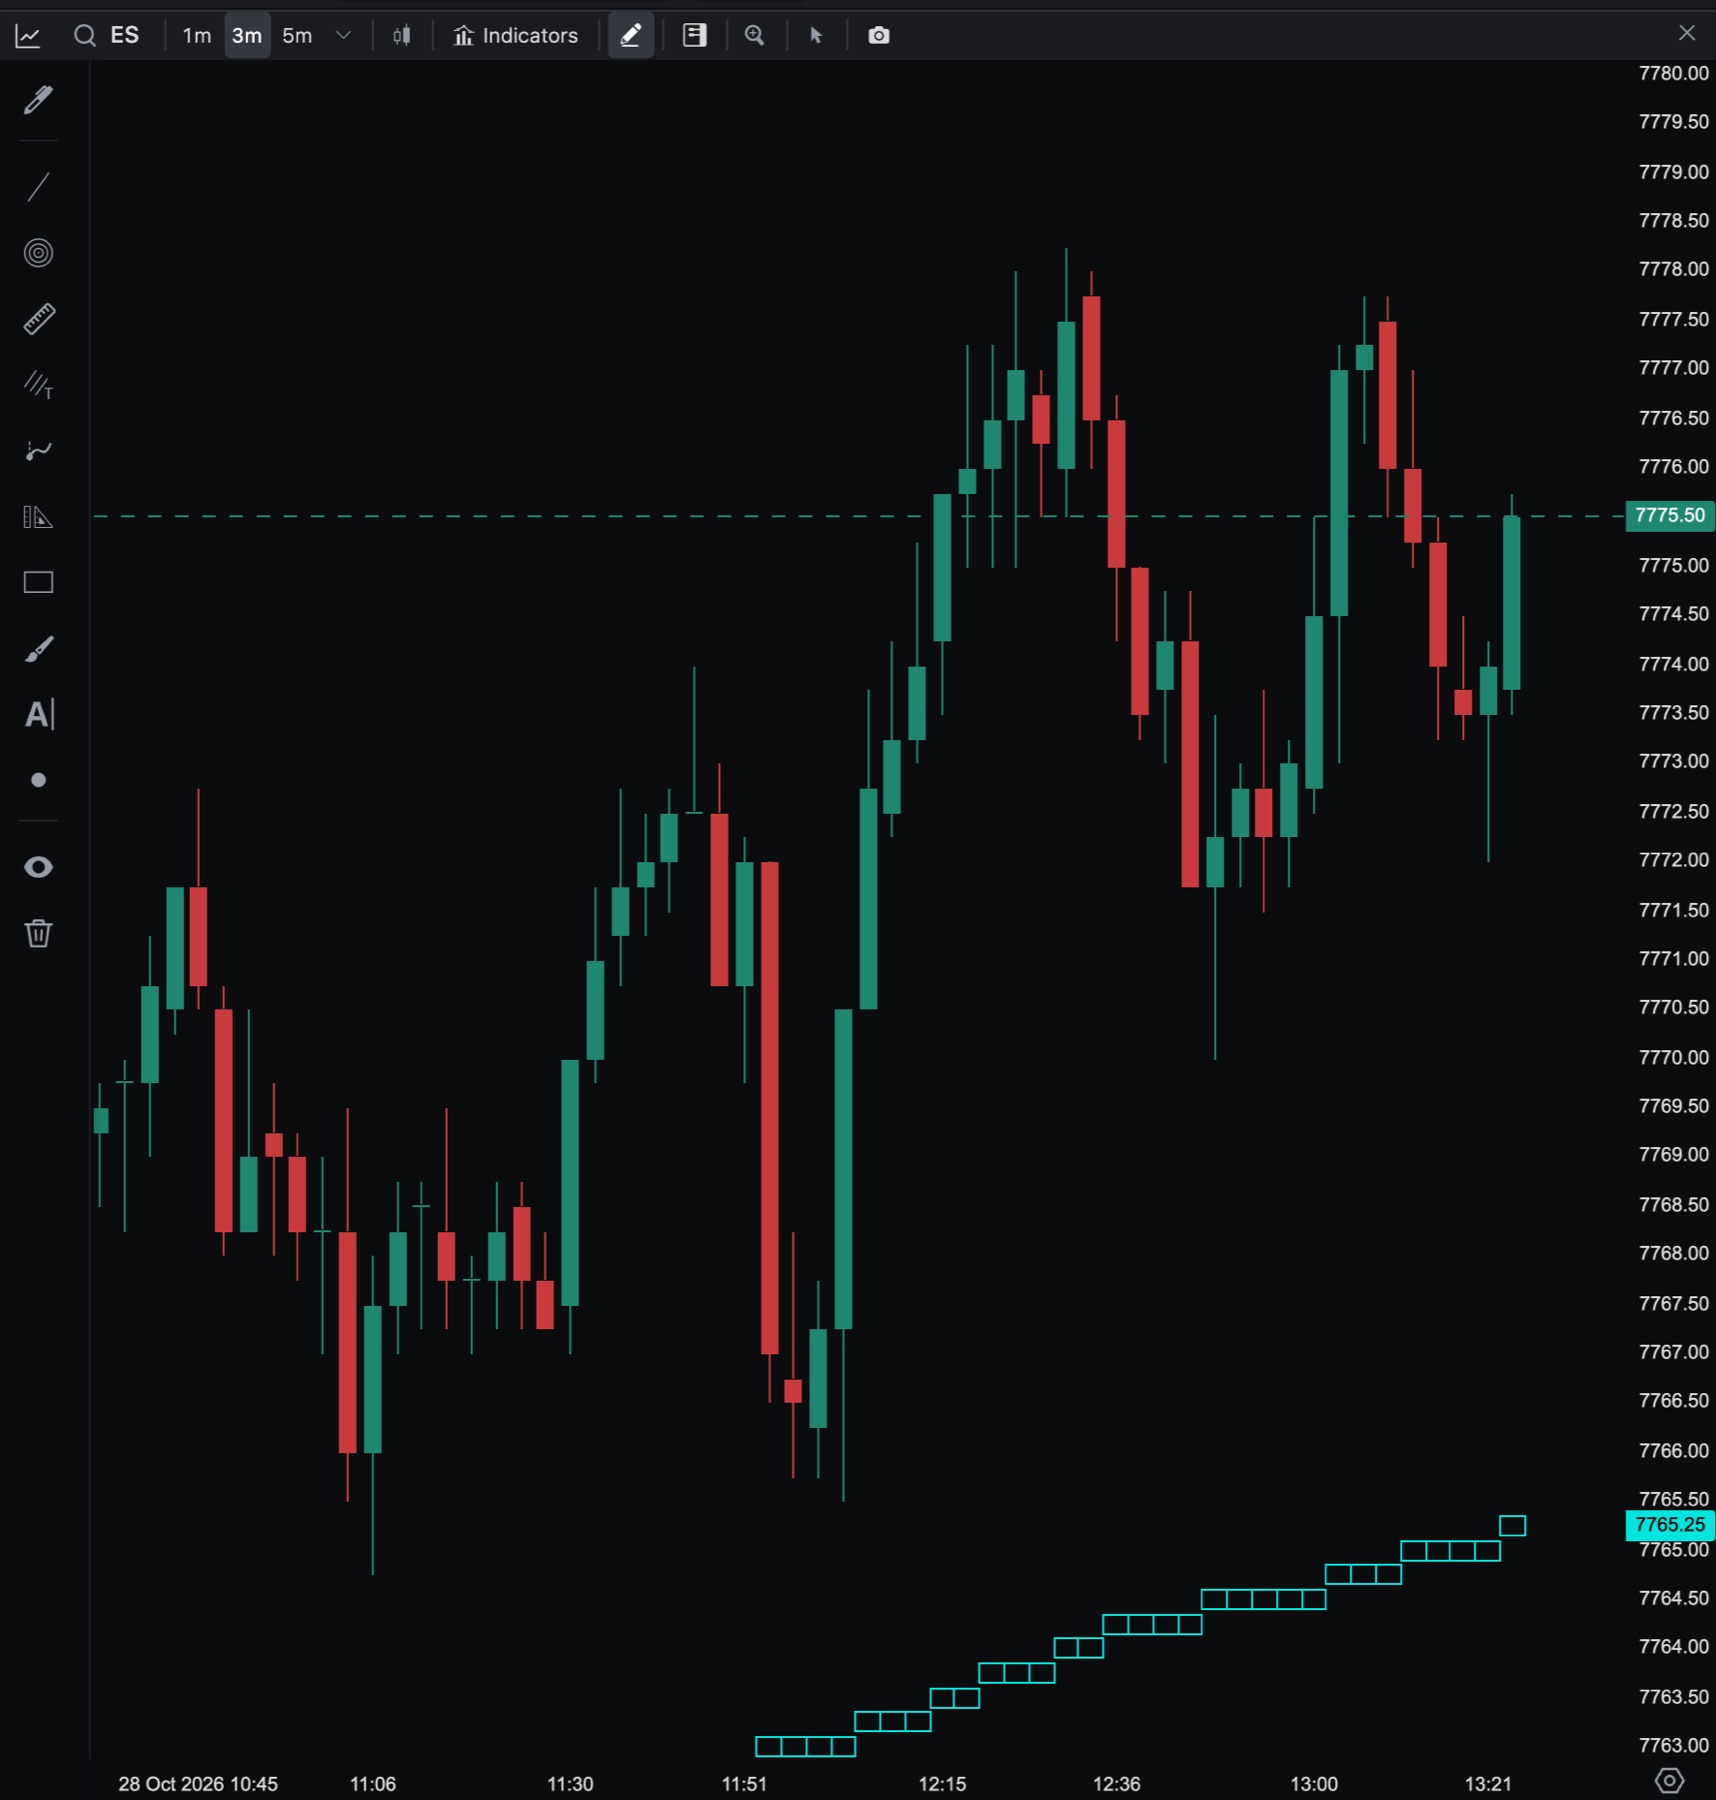
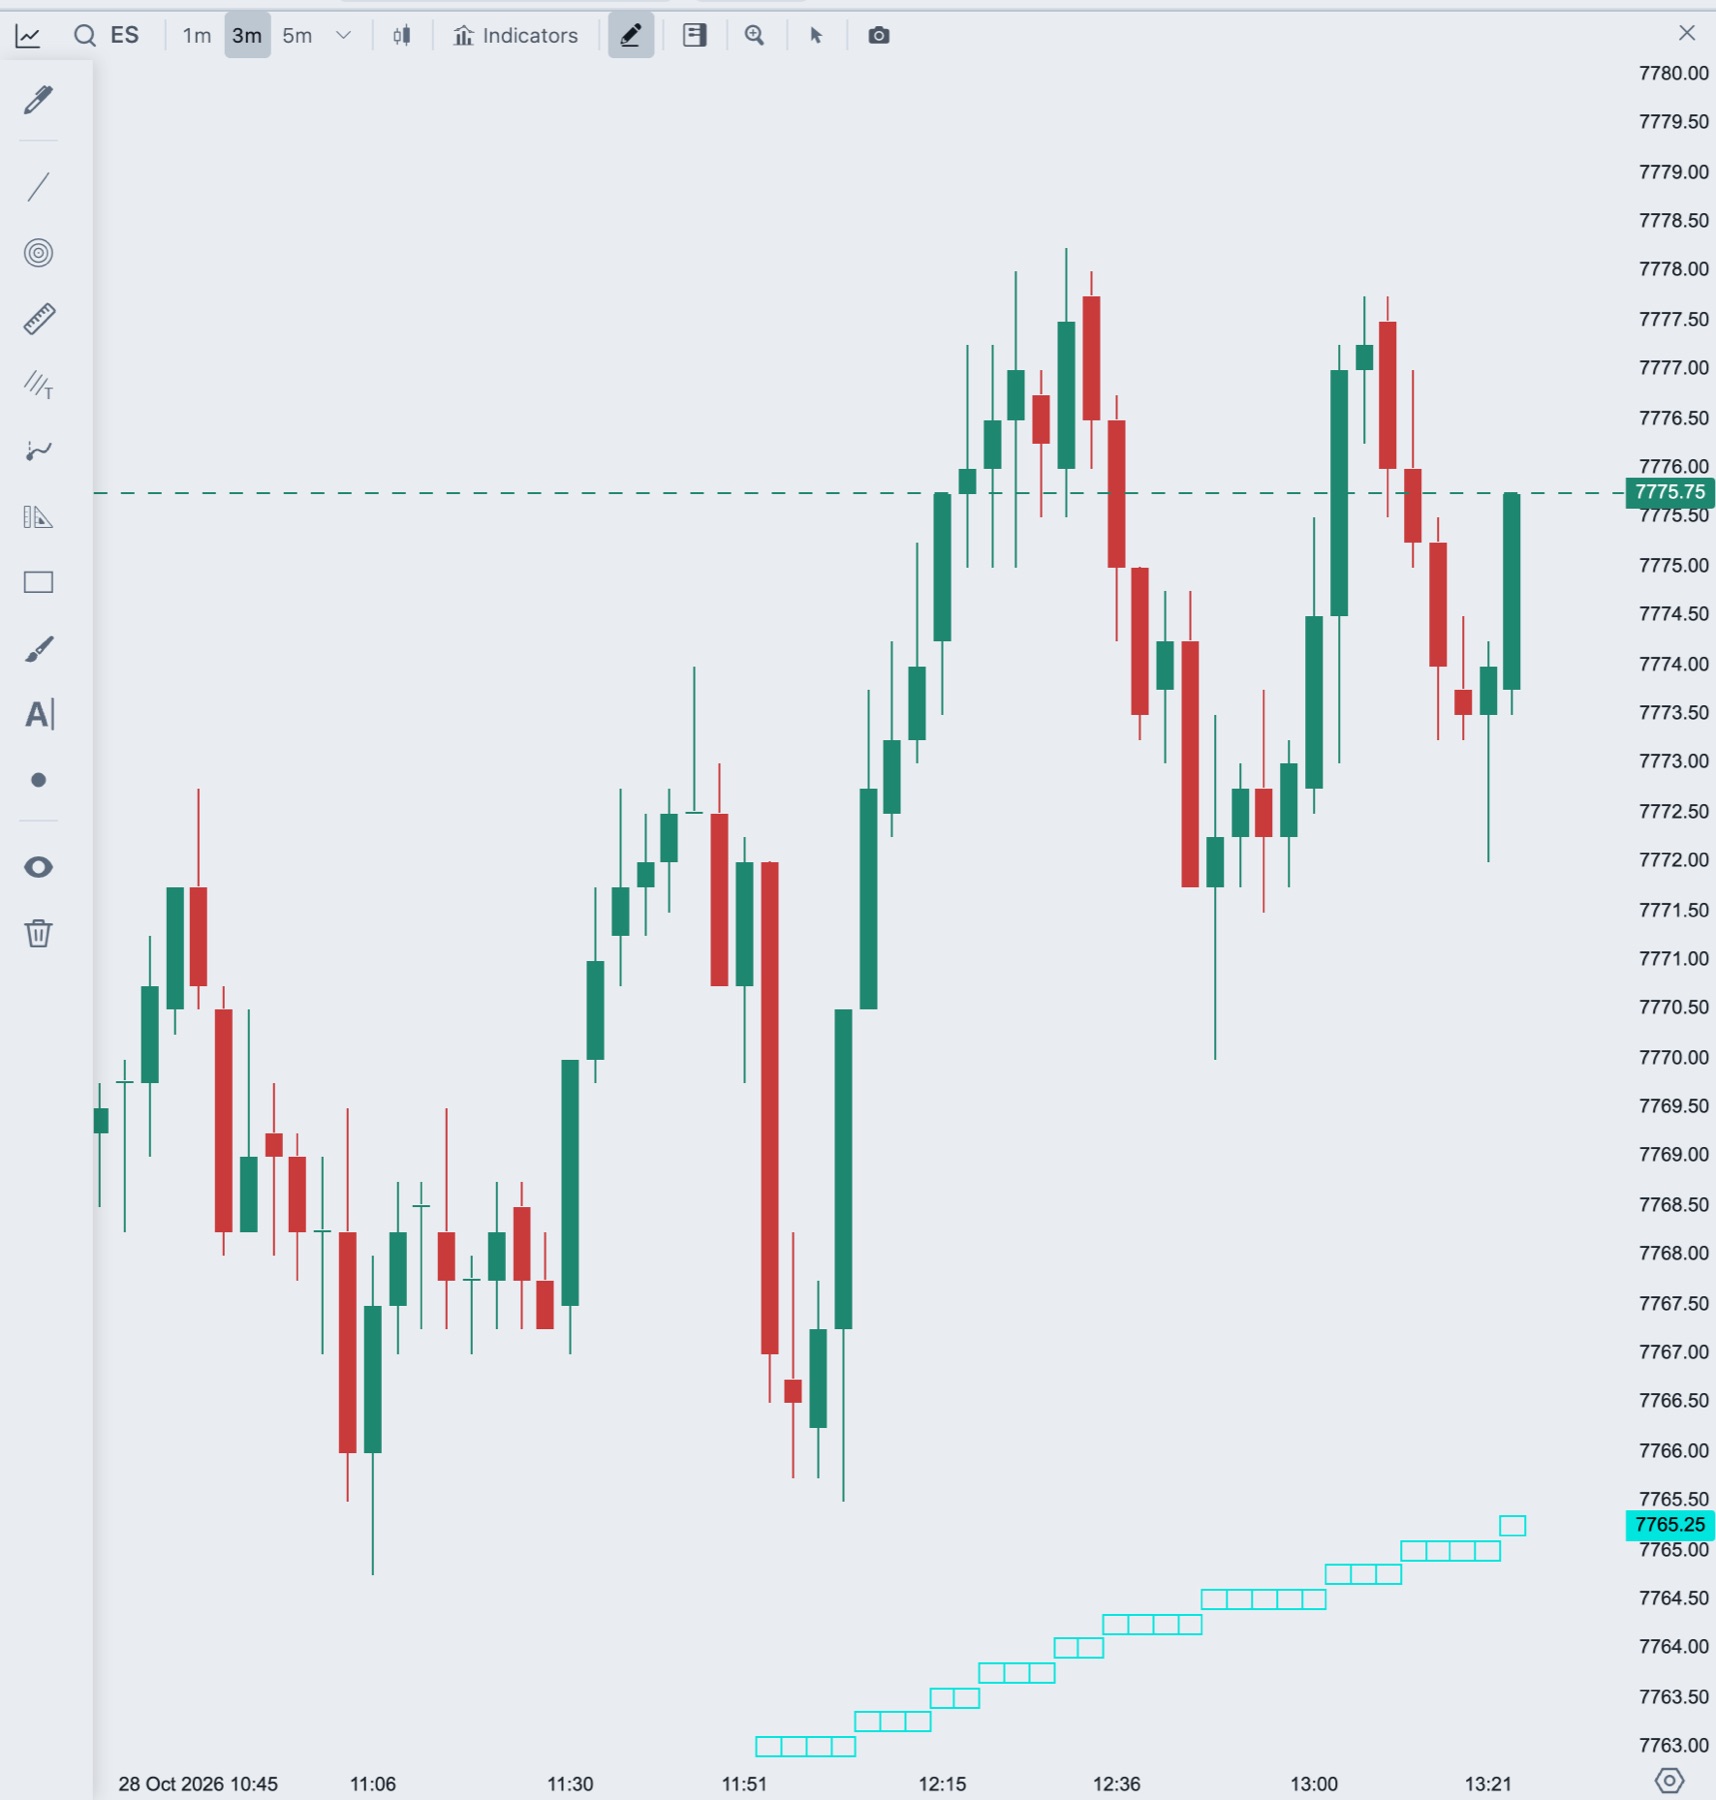
VWAP draws as a line across the chart. With Show VWAP Label on, a label with the name and current value sits on the price scale, joined to the line by a short line. Its line style and length come from the Label settings.
Add VWAP to a chart
- In the chart header, click Indicators.
- Type
VWAPin Search indicators and click VWAP. - Change the settings on the right. You can add VWAP more than once, for example with different styles.
For the Indicators window in general, see Add and manage indicators.
Settings
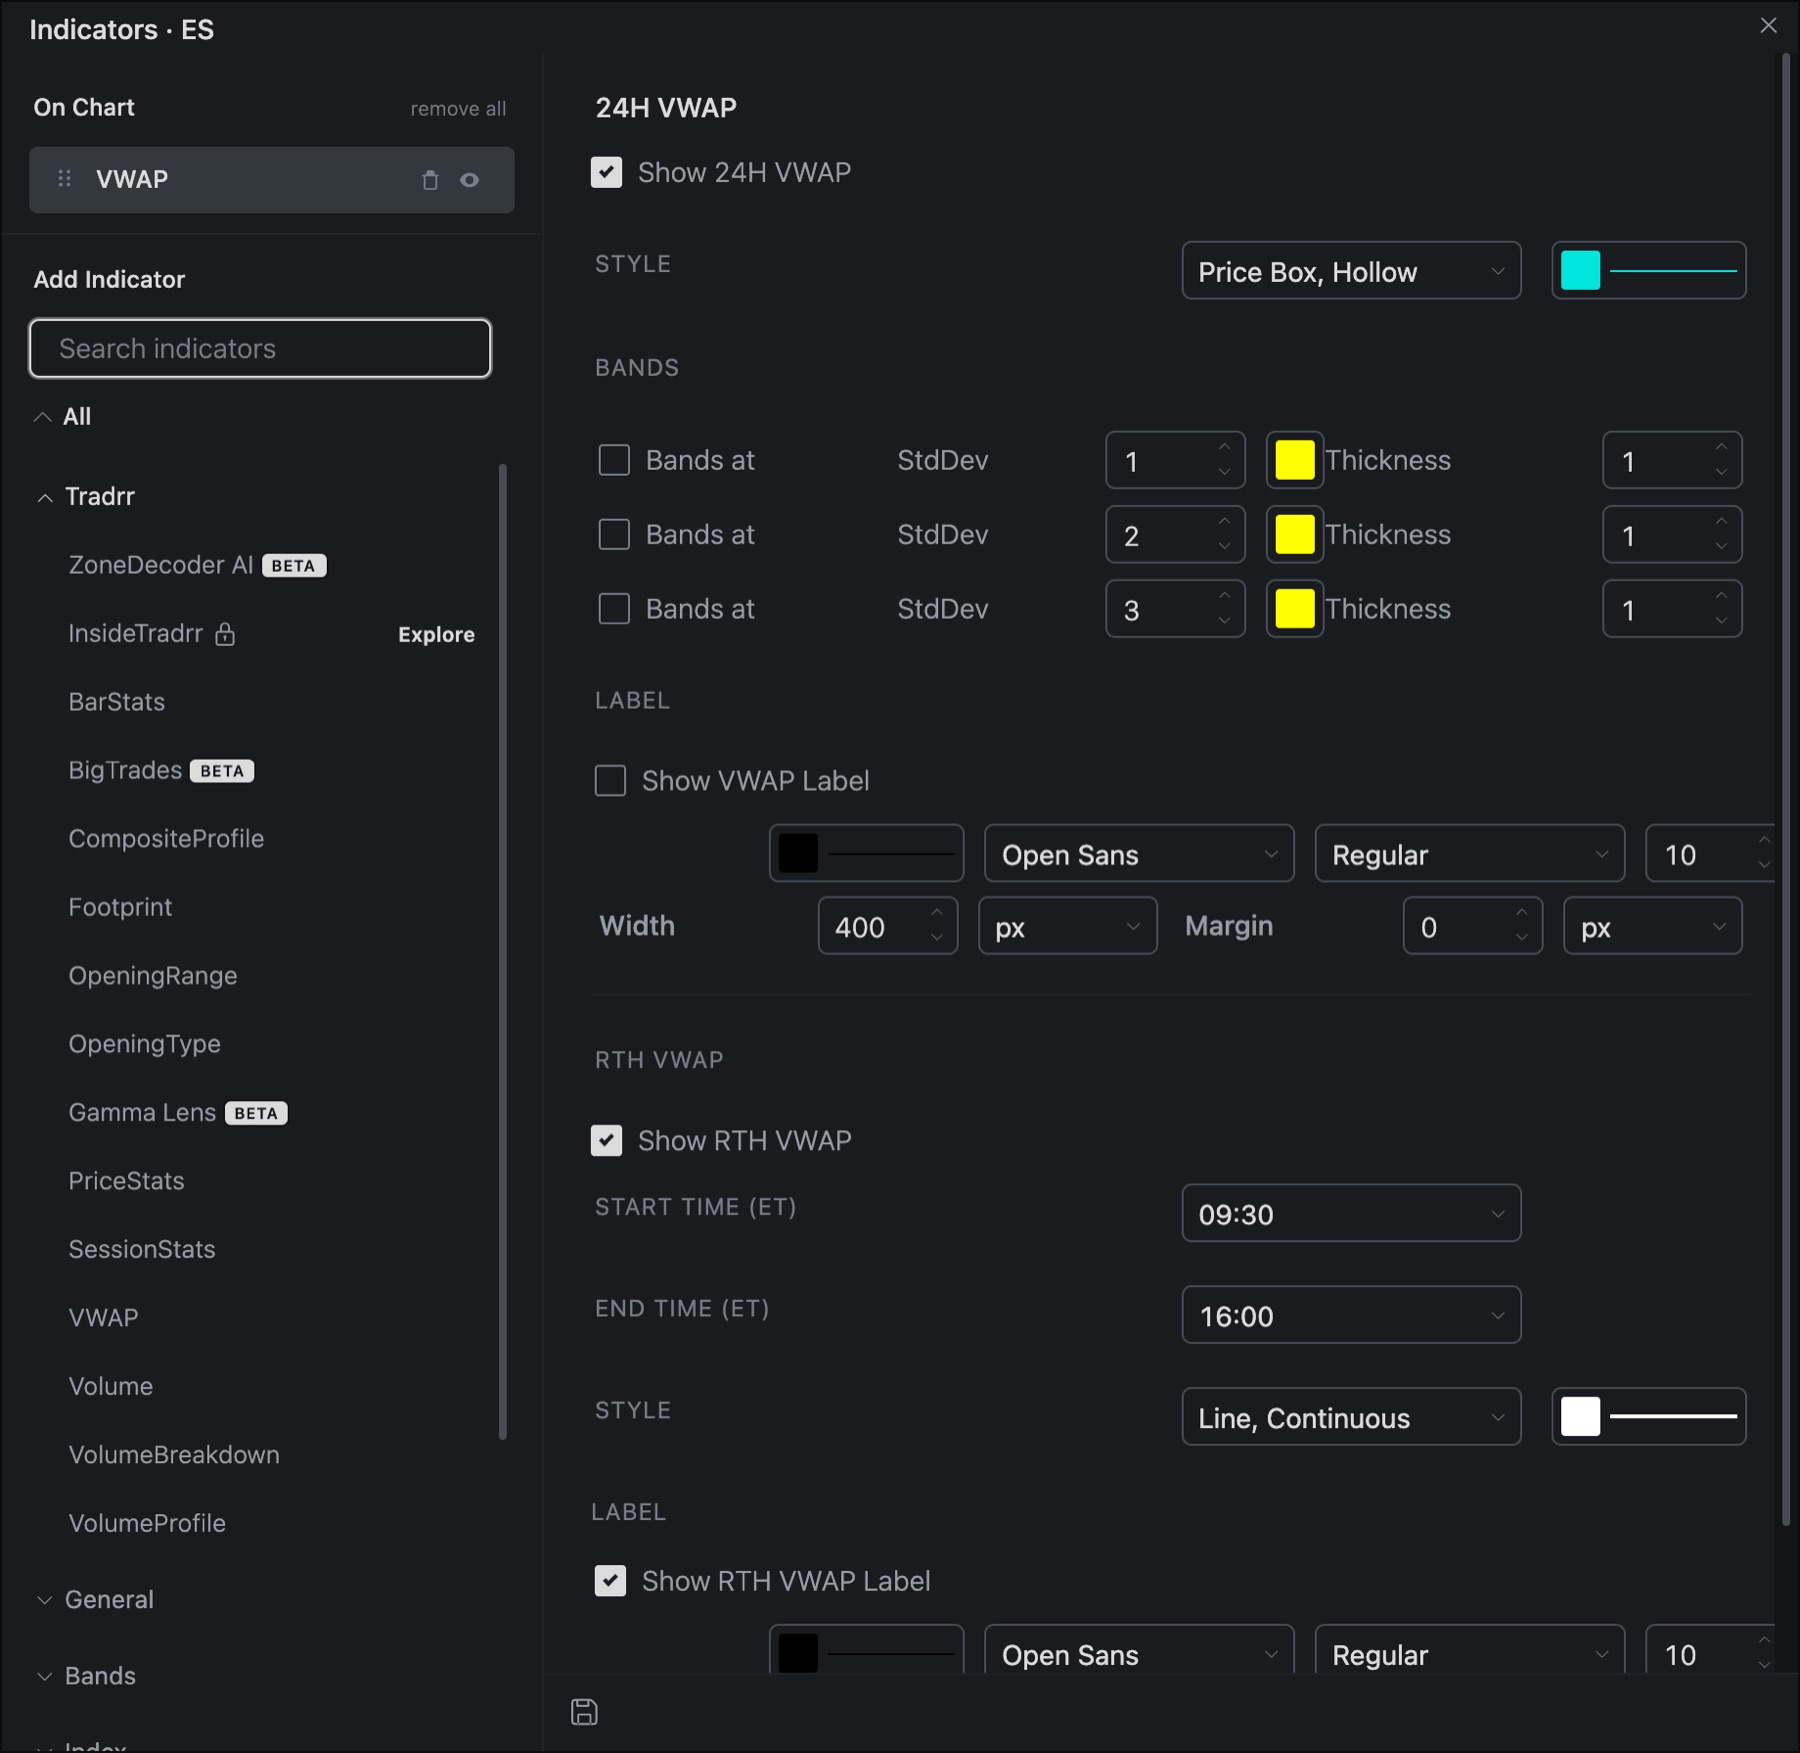
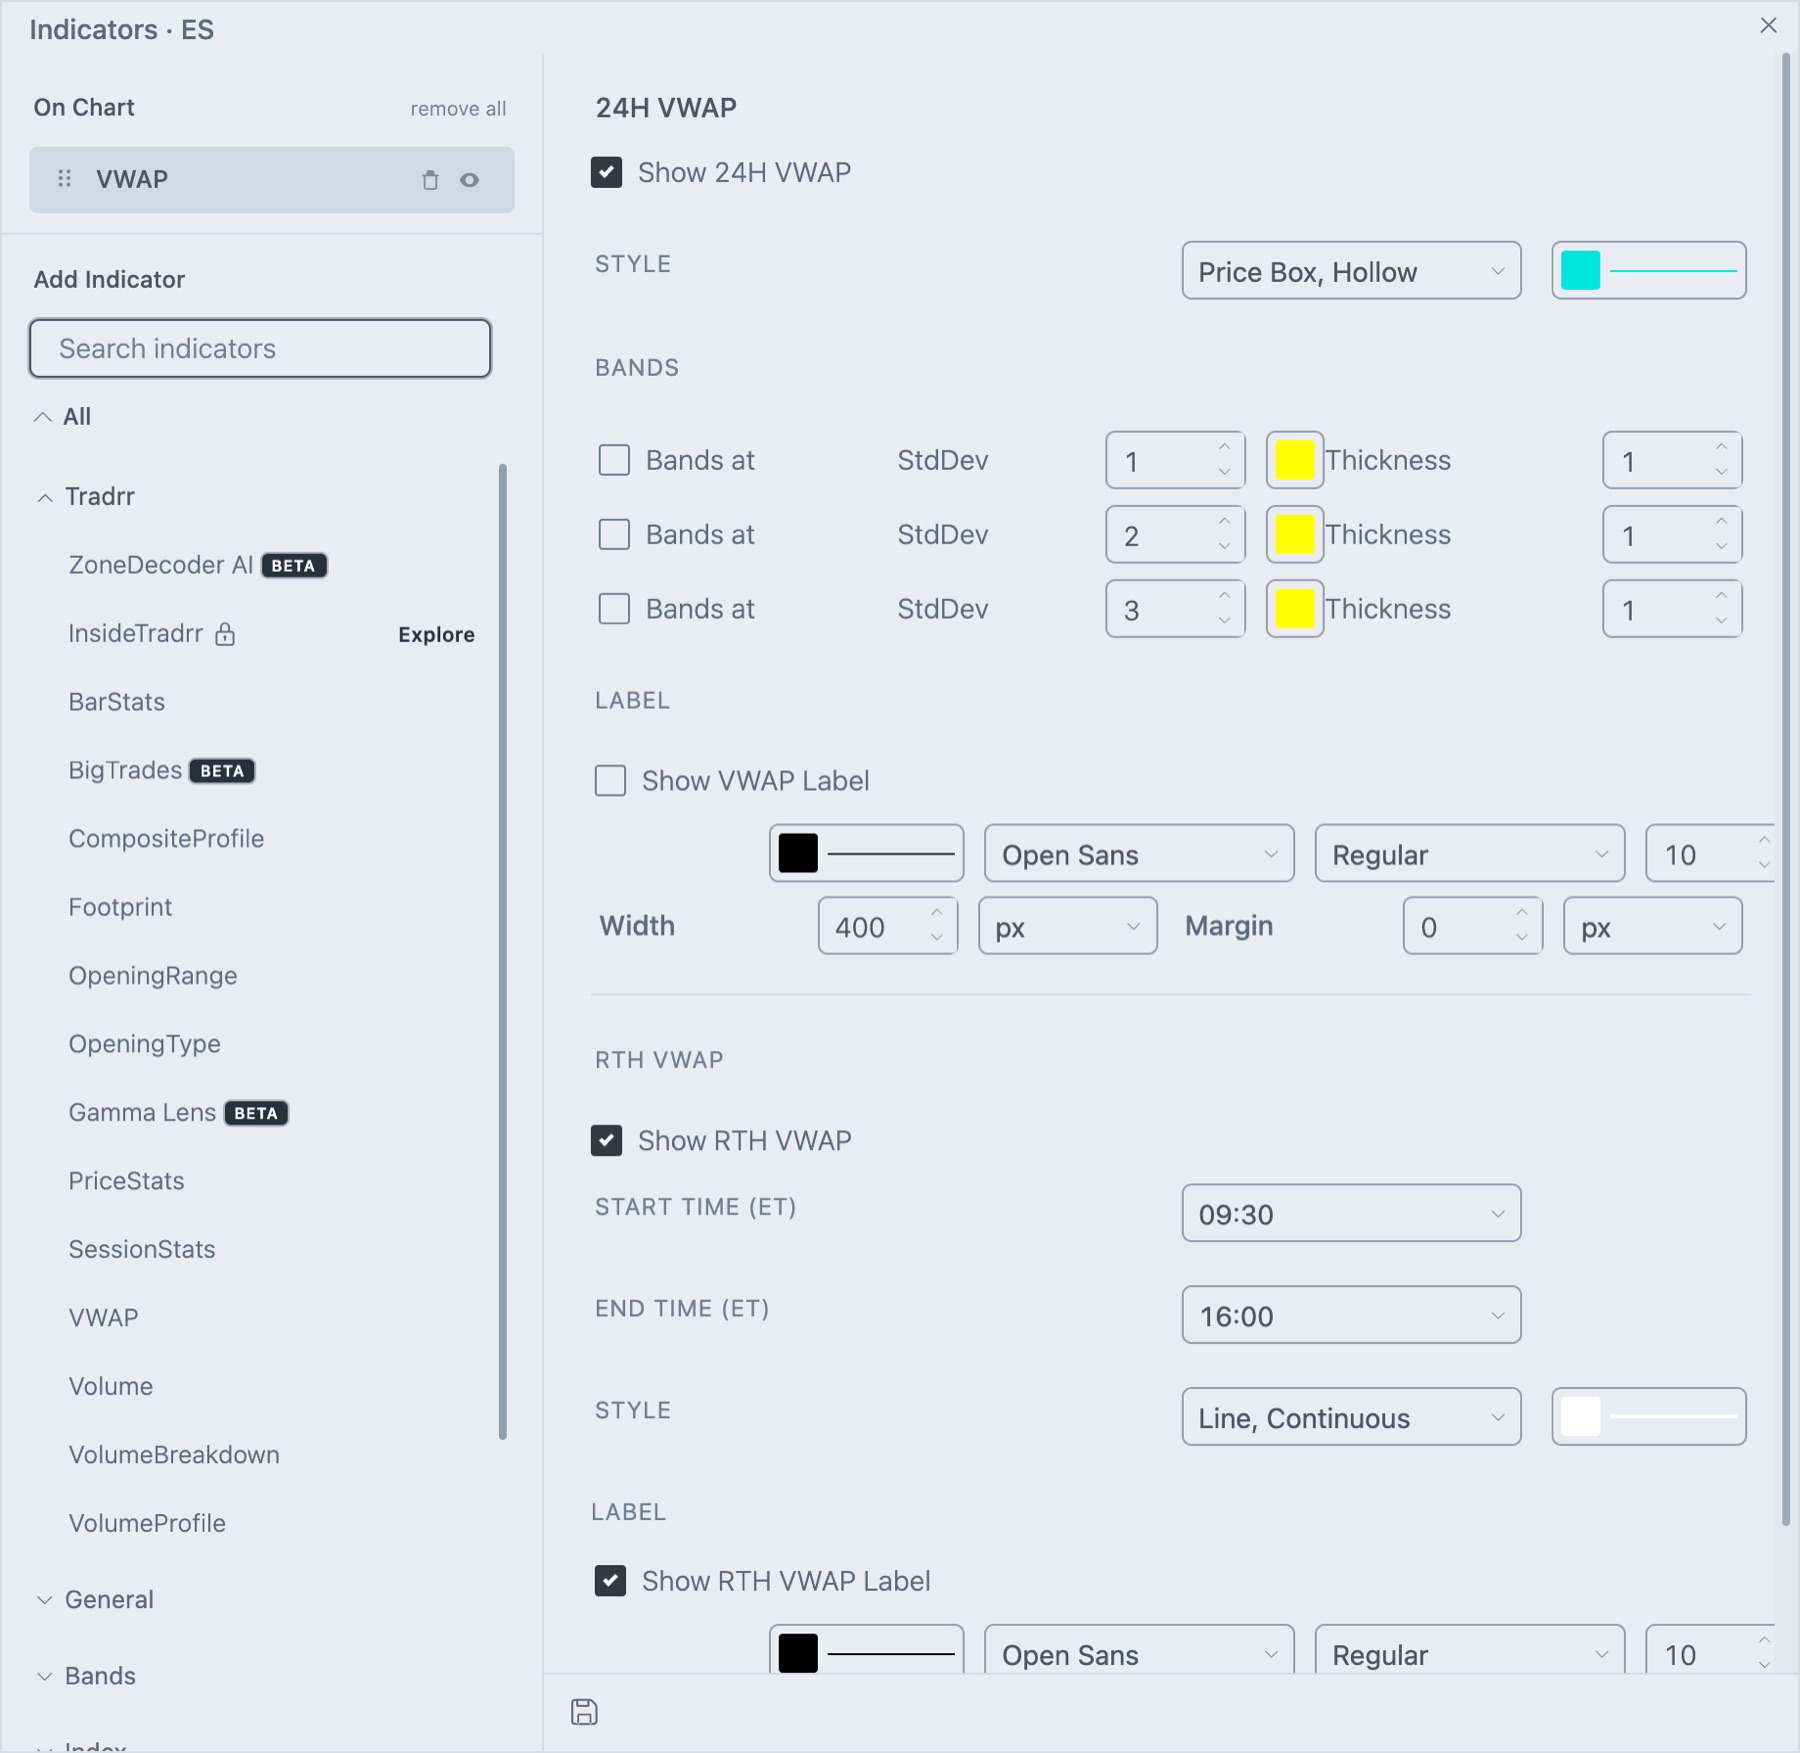
24H VWAP
| Setting | What it does | Default |
|---|---|---|
| Show 24H VWAP | Draws the VWAP that runs across the full trading day. The bands below belong to this line. | On |
| Style | Choose Line, Connected, Line, Continuous, Line, Stepped or Price Box, Hollow. Set the color and the line width and style next to it. | Line, Continuous |
Bands
Each band is drawn above and below the 24H VWAP at the distance you set, measured in standard deviations. The standard deviation is volume-weighted and uses the typical price of each bar around VWAP.
| Setting | What it does | Default |
|---|---|---|
| Bands at | Shows or hides the band. There are three, one per row. | Off |
| StdDev | The distance from VWAP, in standard deviations. The minimum is 0.5, in steps of 0.5. | 1, 1.5 and 2 |
| Thickness | The line width of the band. | 1 |
| Color | The band color, beside StdDev. |
Label
| Setting | What it does | Default |
|---|---|---|
| Show VWAP Label | Shows the VWAP name and value. | Off |
| Fill color and line selector | The label background color, and the color, width and style of the label line. | |
| Font, weight, size | Font Open Sans, Monospace or Sans Serif, weight Regular or Bold, and size. | Open Sans, Regular, 10 |
| Width | The length of the label line, in px or %. | 50 px |
| Margin | The gap between the label and the price scale, in px or %. | 0 px |
RTH VWAP
| Setting | What it does | Default |
|---|---|---|
| Show RTH VWAP | Draws a second VWAP for regular trading hours only. | On |
| Start Time (ET) | When the RTH VWAP starts counting, in New York time. Choose a time in 30-minute steps. | 09:30 |
| End Time (ET) | When the RTH VWAP stops counting, in New York time. | 16:00 |
| Style | The same style choices as 24H VWAP, with color, line width and line style. | Line, Continuous |
| Show RTH VWAP Label | Shows the RTH VWAP name and value. It has the same fill, line, font, Width and Margin settings as the 24H label. | On |
How traders read it
- Above VWAP: buyers have paid more than the session average. Pullbacks to VWAP often draw responsive buying.
- Below VWAP: sellers are in control of the session so far.
- Crossing back and forth: the market is balanced, and VWAP is a poor guide to direction.
- Bands: price near an outer band is far from the day's average, which some traders treat as stretched.
Tip. Use the RTH VWAP when you trade the cash session and want overnight trading left out. Pair VWAP with Volume Profile: when VWAP sits near the profile's point of control, both measures agree on fair value.
Related articles
Was this article helpful?