Oscillators
An oscillator turns price movement into a value that swings around a center line or between fixed limits. Traders use oscillators to judge momentum, volatility and whether a move has gone too far. Tradrr has 28 of them in the Oscillator group of the indicator list.
- Shows
- One or more lines or columns in a panel under the chart
- Updates
- On every bar update
- Best on
- Any time chart
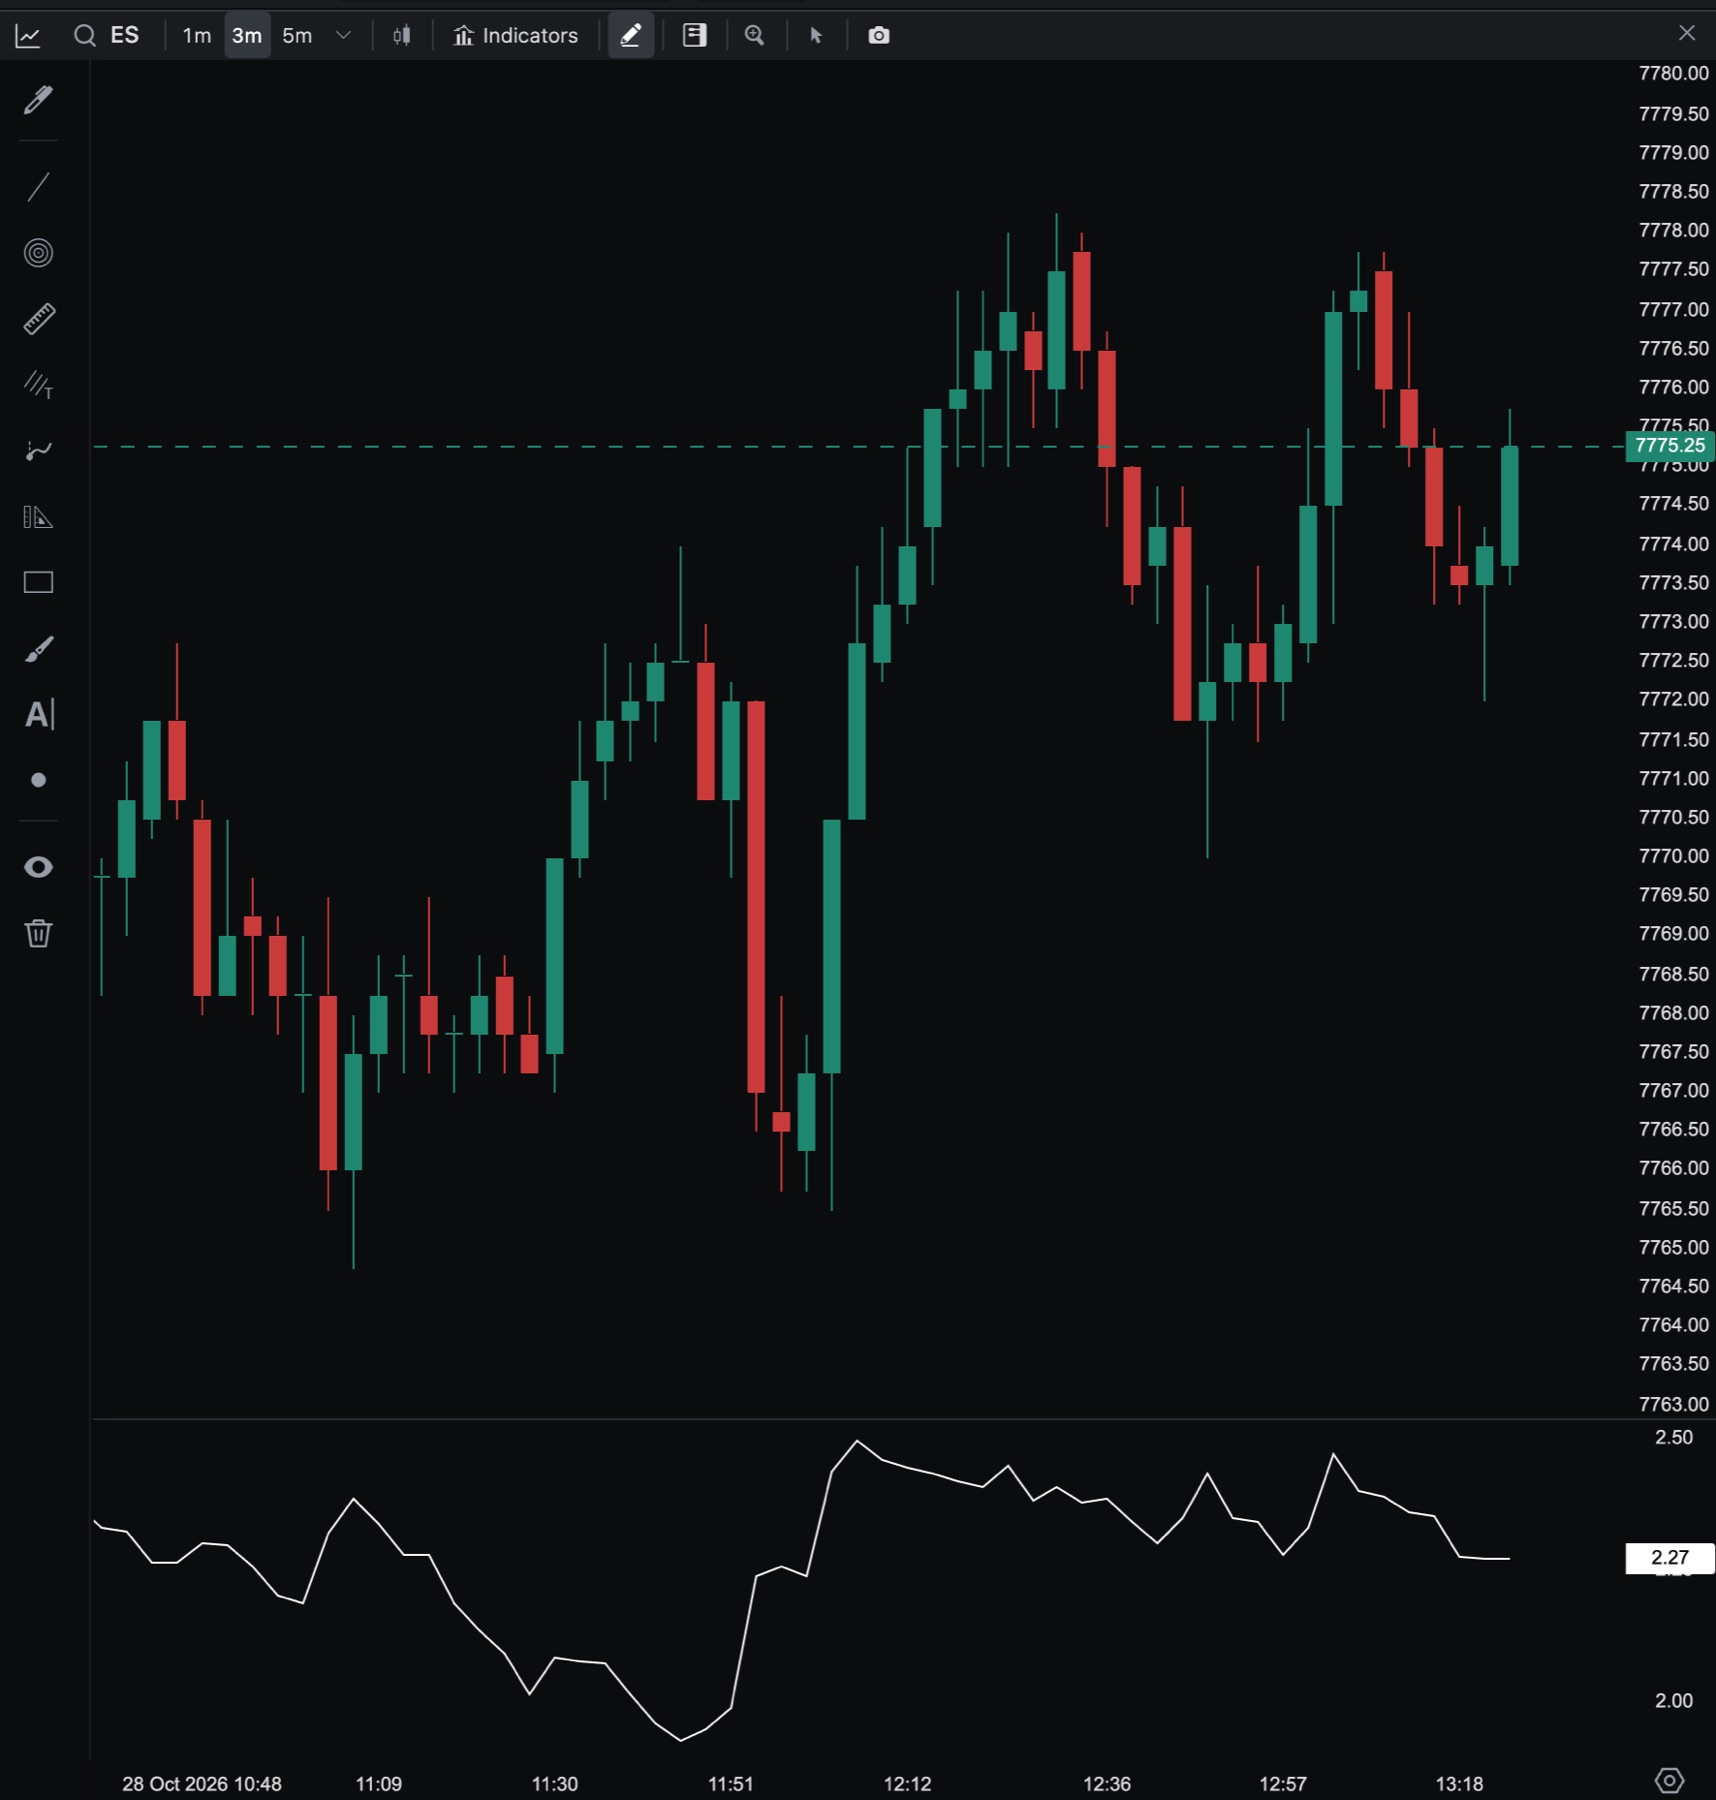
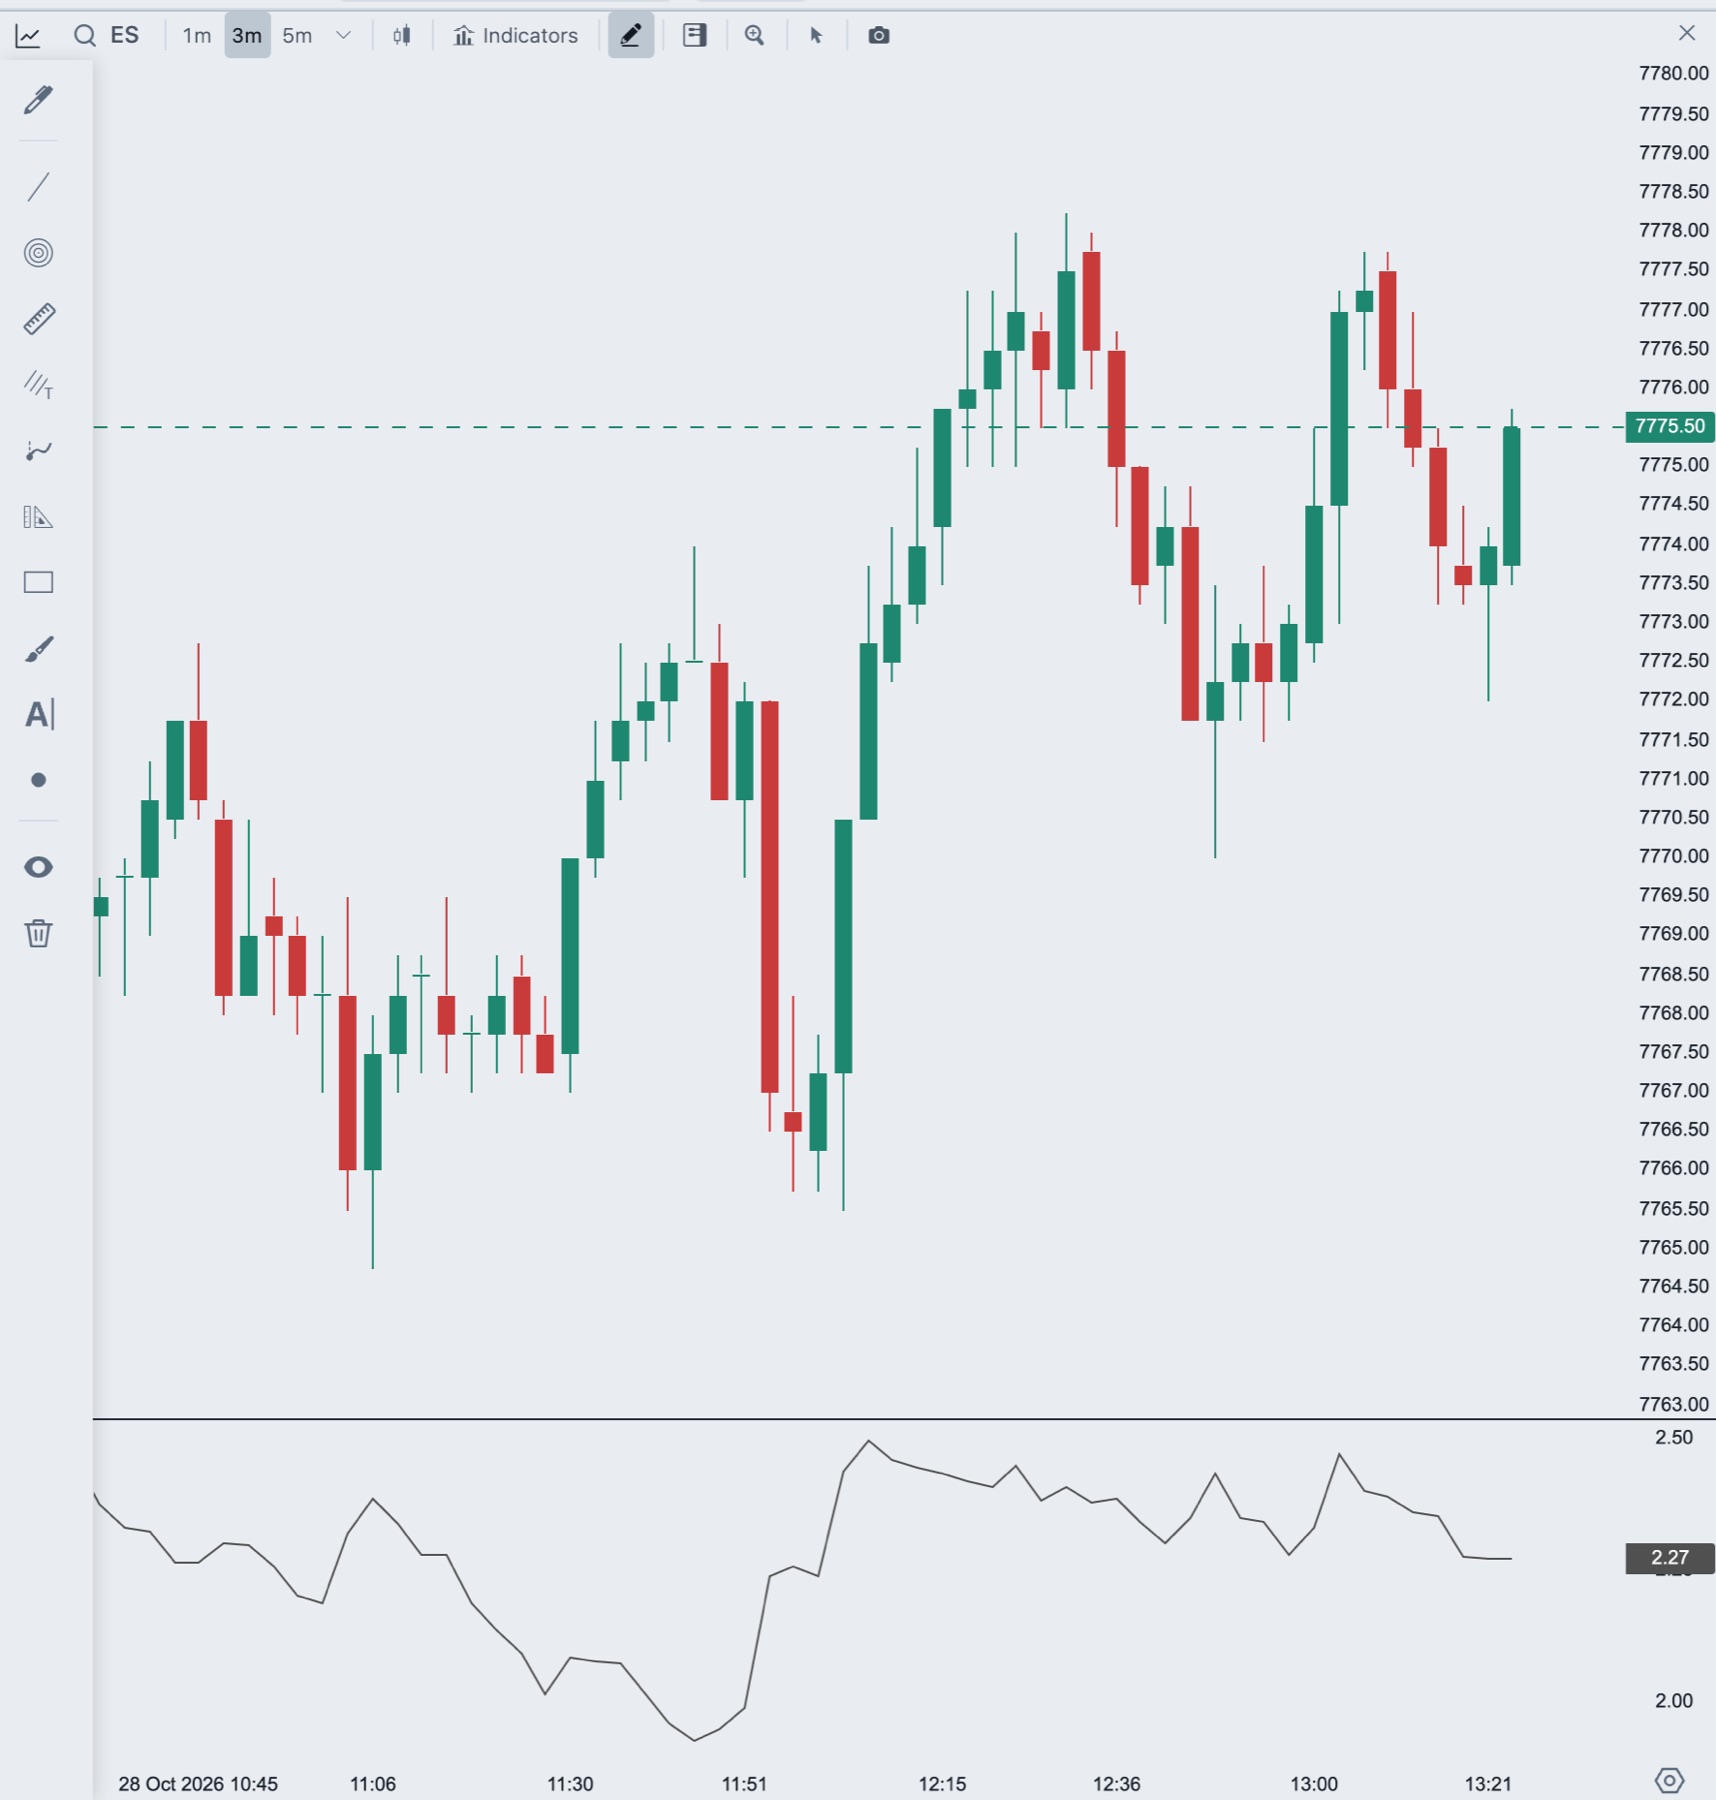
Add an oscillator
- In the chart header, click Indicators.
- Under Add Indicator, open the Oscillator group, or type the name, for example
MACD, in Search indicators. - Click the name. It is added to the chart and its settings open on the right.
All oscillators except TSF draw in their own panel below the price chart. You can add the same oscillator more than once. The second copy is named, for example, MACD (2). See Add and manage indicators for hiding, reordering and removing indicators.
The indicators
The names below are the names in the indicator list. WillamsR is spelled that way in the list.
| Name | What it is |
|---|---|
| AroonOscillator | Aroon Up minus Aroon Down. Rises above zero when highs are recent and falls below zero when lows are recent. Tells you whether a trend exists. |
| Aroon | Two lines, Up and Down, showing how recently price made a new high or low. Draws reference levels at 30 and 70. |
| ATR | Average True Range, by Welles Wilder. Measures volatility. |
| CenterOfGravity | John Ehlers' oscillator. Compares recent prices with older prices inside a sliding window. |
| ChaikinVolatility | Rate of change of a moving average of the bar range. Rises when ranges expand. |
| MACD | The gap between a fast and a slow exponential average, a signal line and a histogram of the difference. |
| TSF | Time Series Forecast. Extends the linear regression line forward by a set number of bars. Draws on the price chart. |
| CFO | Chande Forecast Oscillator. The percentage difference between price and its linear regression forecast. |
| FOSC | Forecast Oscillator. Compares the close with its time series forecast, in percent. |
| ChaikinOscillator | The gap between a fast and a slow exponential average of the accumulation/distribution line. |
| CMO | Chande Momentum Oscillator. Compares the sum of up moves with the sum of down moves, from -100 to 100. |
| CoppockCurve | Two rates of change added together and smoothed with a weighted moving average. |
| PriceOscillator | The spread between two moving averages, smoothed. |
| DM | Directional Movement. Three lines: ADX for trend strength, +DI and -DI for direction. |
| EasyOfMovement | Relates the price change to volume. High positive values mean price is rising on low volume. Strong negative values mean it is falling on low volume. |
| EFT | Ehlers Fisher Transform. Reshapes prices so turning points show as sharp peaks. Plots an indicator line and a trigger line. |
| ElderRay | BullPower and BearPower. Compares the bar high and low with a moving average. |
| TrueRange | Welles Wilder's true range: the largest of the bar range and the gaps from the previous close. |
| TRIX | The rate of change of a triple exponential average, with a signal line. Draws a zero line. |
| Stochastics | Where the close sits inside the recent high to low range, as %K and %D lines. Draws reference levels at 20 and 80. |
| StochasticsFast | The same idea with an unsmoothed %K. Draws reference levels at 20 and 80. |
| UltimateOscillator | Larry Williams' oscillator. Combines buying pressure over three periods. Draws reference levels at 30, 50 and 70. |
| VolumeOscillator | The difference between a fast and a slow moving average of volume, shown as columns. |
| PGO | Pretty Good Oscillator. Measures how far the close is from its simple moving average, in units of average true range. |
| WillamsR | Williams %R. Shows the close against the high and low of the last N bars, from 0 to -100. Draws reference levels at -25 and -75. |
| PPO | Percentage Price Oscillator. The gap between a fast and a slow exponential average as a percentage of the slow one, with a smoothed line. |
| WAD | Williams Accumulation Distribution. A running total of price changes measured against the true high and low. |
| PNO | Prime Number Oscillator. The distance from the close to the nearest prime number. |
Settings
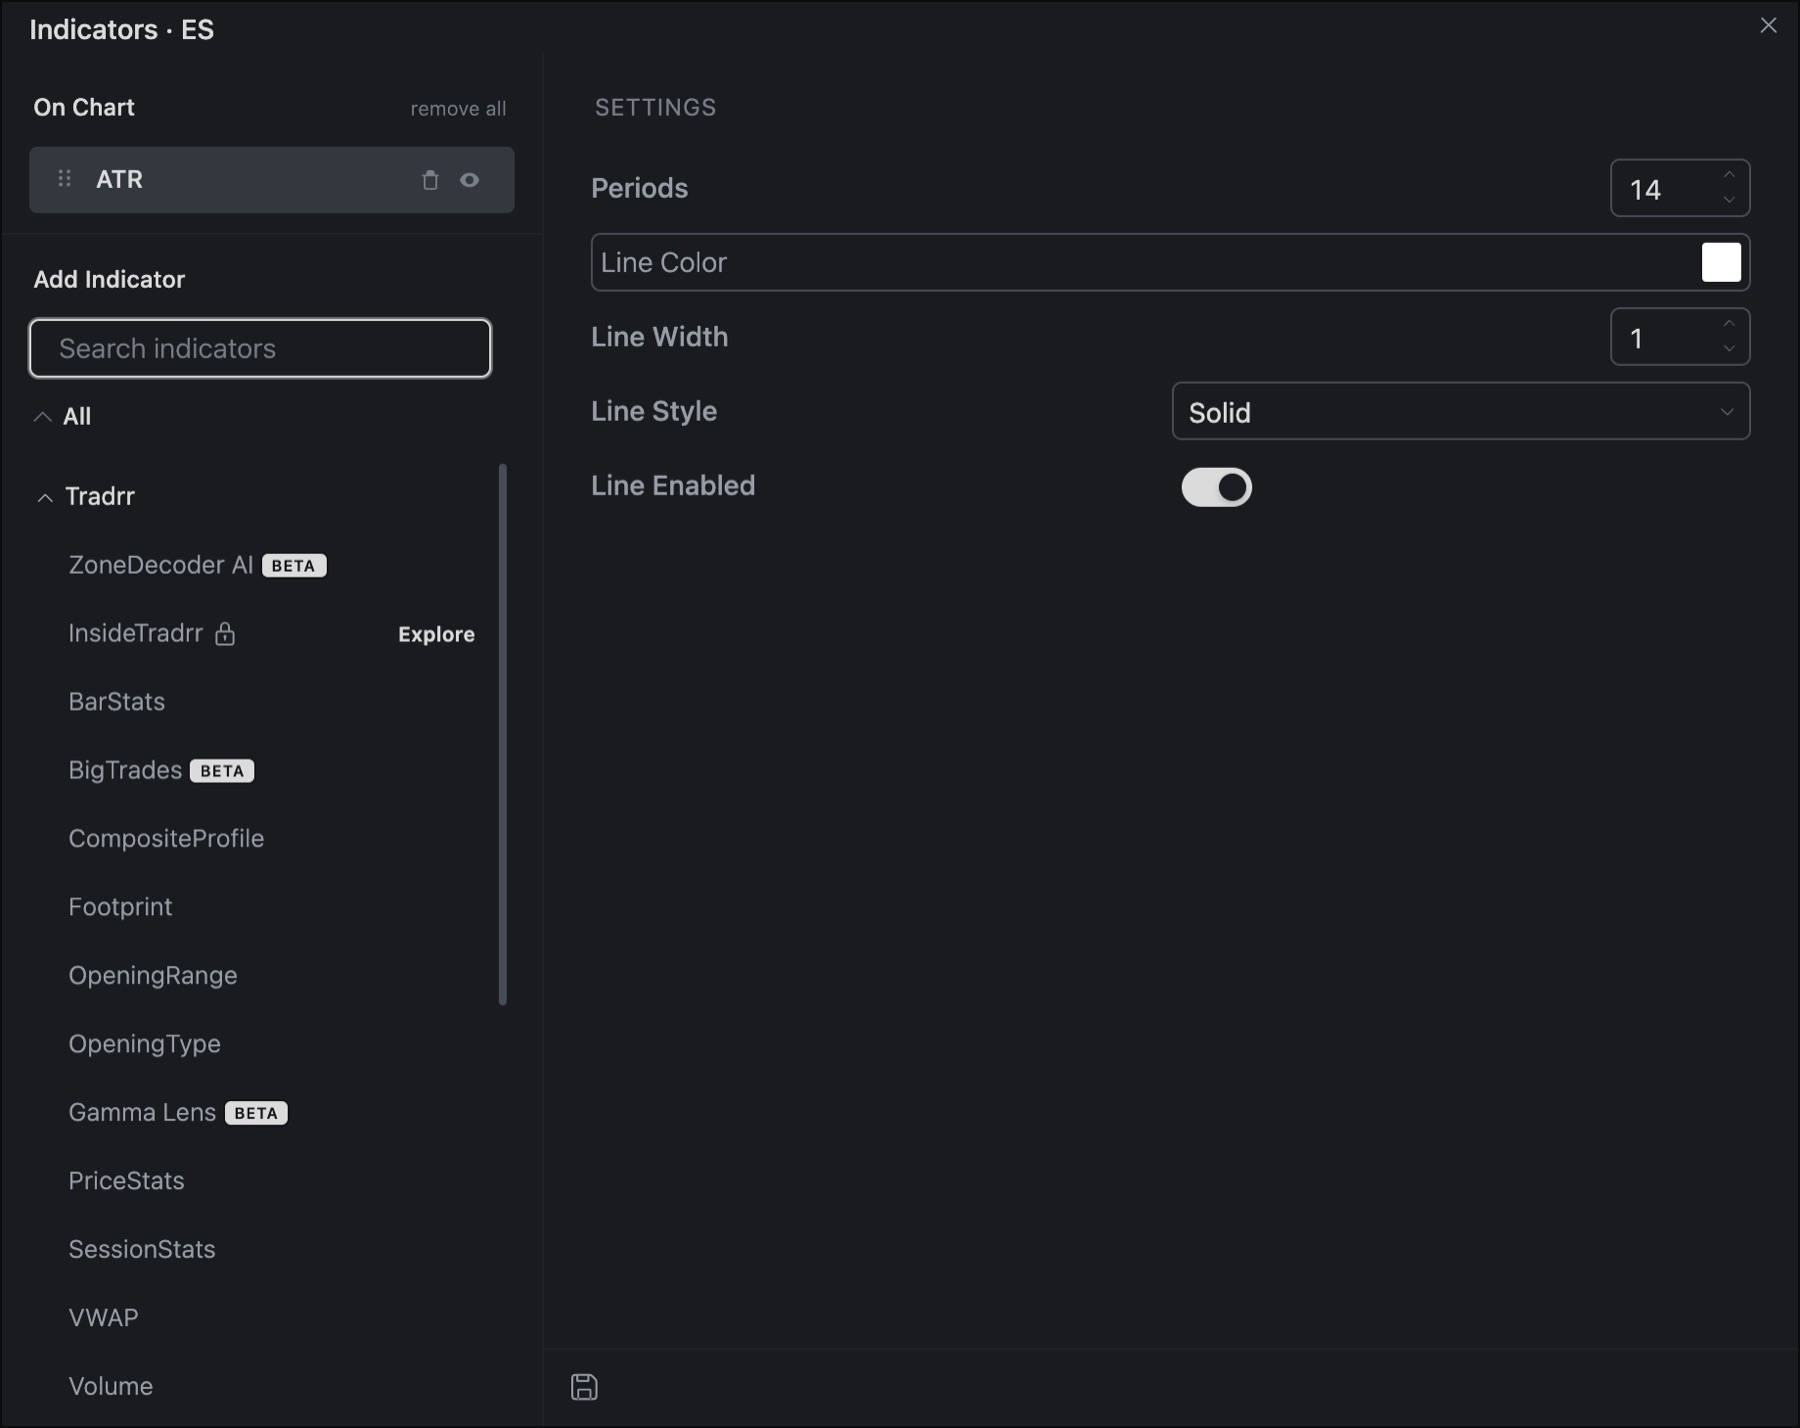
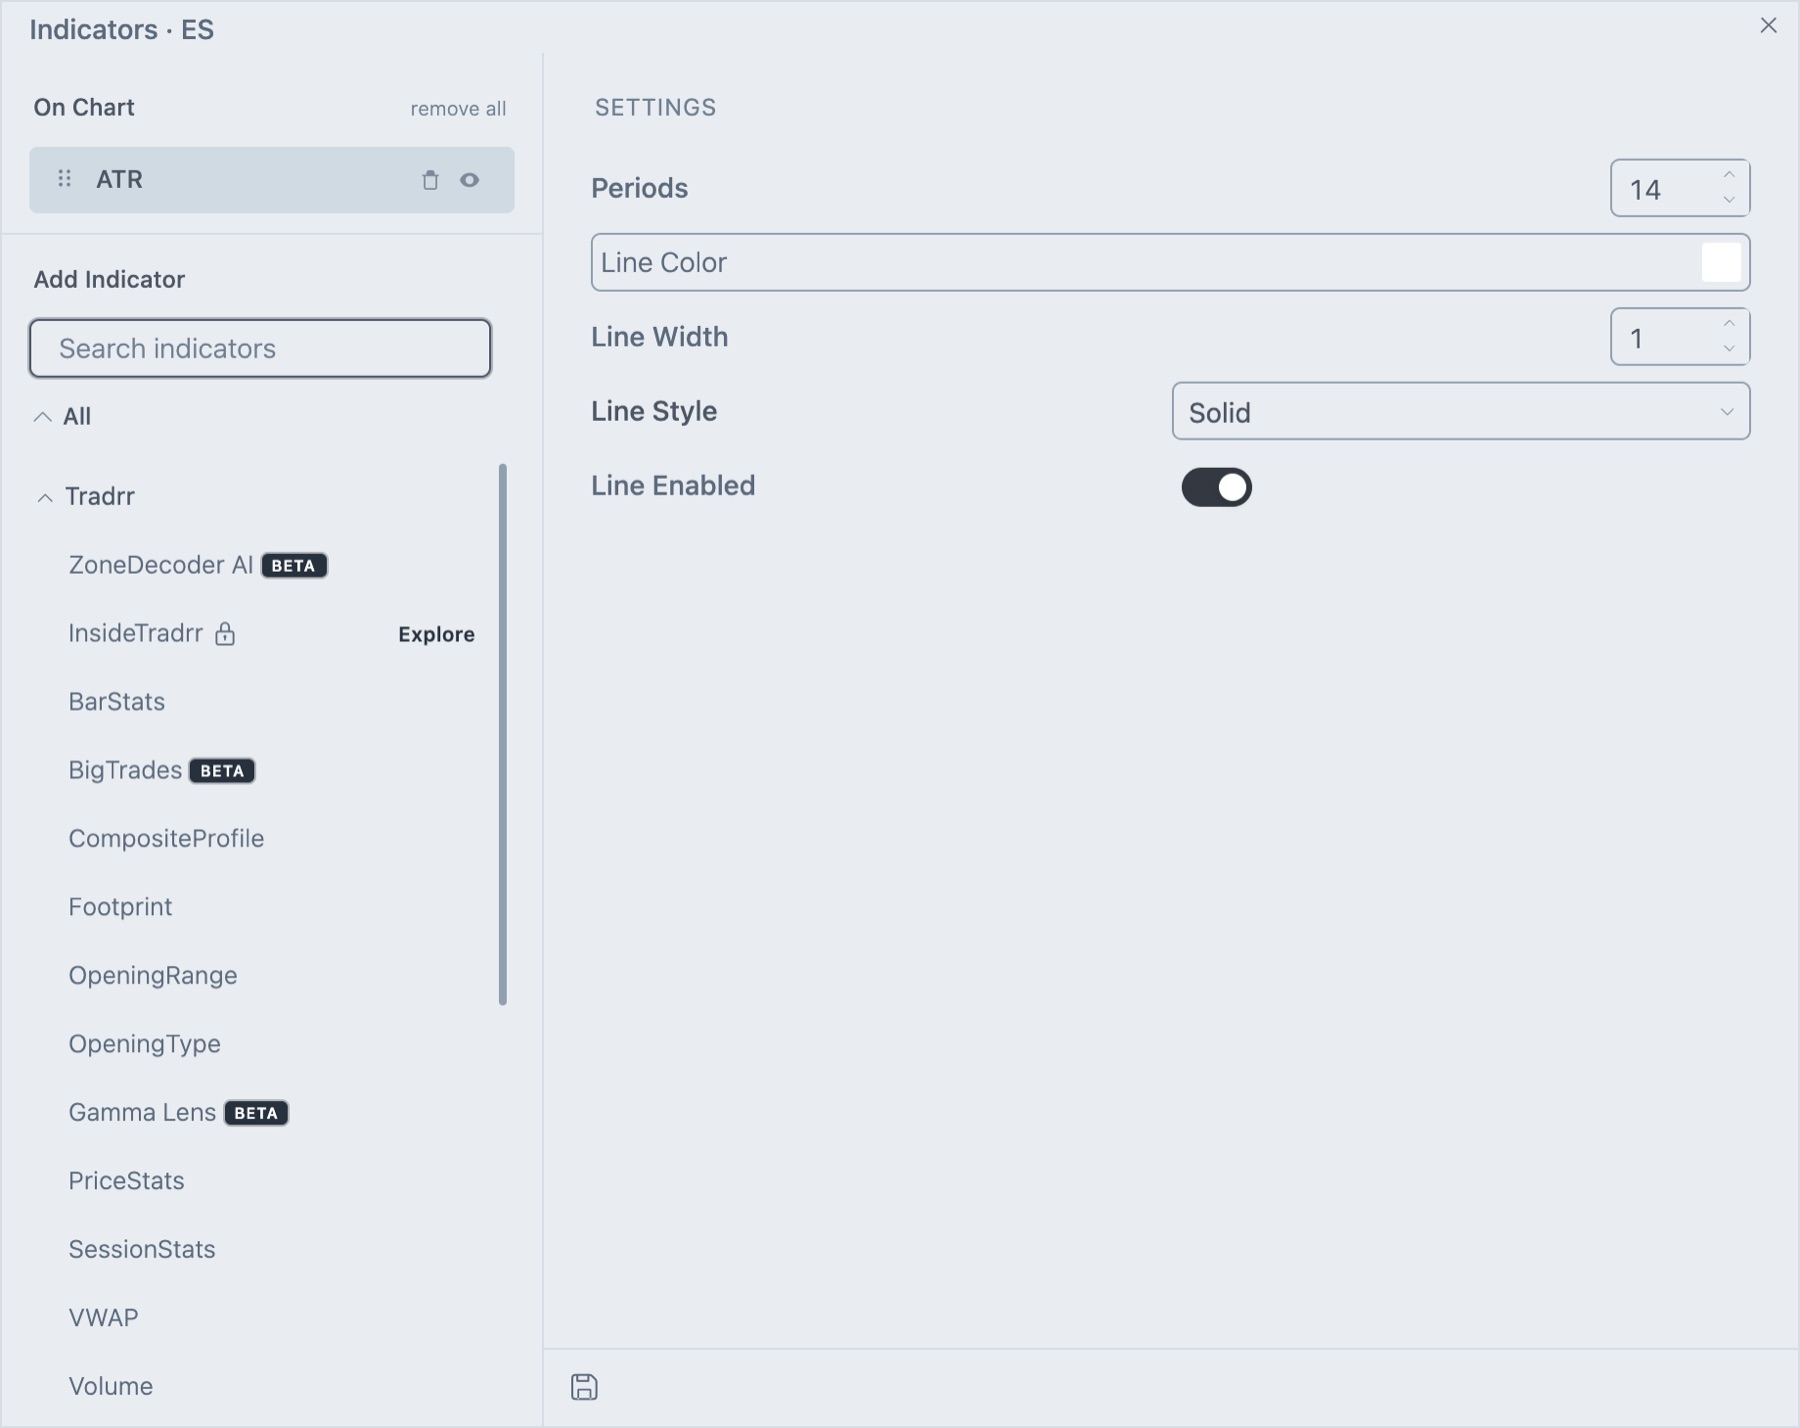
Each oscillator opens a Settings group with the fields that apply to it. ATR, shown above, has Periods (14), Line Color, Line Width (1), Line Style (Solid) and Line Enabled. Fields you can find across the group:
| Setting | What it does |
|---|---|
| Periods | How many bars the calculation uses. Most oscillators start at 14. |
| Source | The price the oscillator uses: Open, High, Close, Volume, Weighted, Typical or Median. Only indicators that take a source show it. ATR does not. |
| Line Color, Line Width, Line Style | Color, thickness and Solid, Dash, Dot or Dash-Dot style of each line. |
| Line Enabled | Switch that hides or shows a line. Oscillators with several lines, such as MACD, have one set per line. |
Many oscillators add their own fields, for example Fast (12), Slow (26) and Smooth (9) on MACD, or Forecast (3) on TSF. To start every new copy of an oscillator with your settings, click the save icon at the bottom of the settings and choose Save as Default Template.
How traders read them
- Overbought and oversold: oscillators with fixed limits, such as Stochastics and Williams %R, show when price sits near the top or bottom of its recent range. Price can stay there in a strong trend, so use it as a warning, not a signal.
- Zero-line crossings: oscillators centered on zero, such as MACD and TRIX, change sign when momentum turns.
- Divergence: price makes a new high or low and the oscillator does not. This can show that momentum is fading.
- Volatility readings: ATR and TrueRange do not point up or down. Traders use them to size stops and targets to current conditions.
Tip. Pick one or two oscillators and learn how they behave on your instrument. Several oscillators on one chart often show the same thing.
Related articles
Was this article helpful?