Session Stats
Session Stats draws the highs, lows and midpoints of the sessions that matter to day traders, each with a short label at the price scale. Use it to see where the overnight, regular-hours and previous-session extremes sit relative to price.
- Shows
- Up to 14 labelled session levels
- Updates
- As the session develops, with live highs and lows
- Best on
- Intraday time charts
What it measures
Session Stats splits the chart into two sessions that you choose: regular trading hours (RTH) and the overnight session. For each one it finds the highest price, the lowest price and the midpoint between them. It also marks the first hour of RTH (the initial balance), the RTH open, the previous RTH session and the previous week.
Each level is a horizontal line across the session it belongs to. The label sits at the price scale, so you can read the level name and price without tracing the line.
When two levels sit at exactly the same price, their labels join into one, for example ONHi · RTHHi.
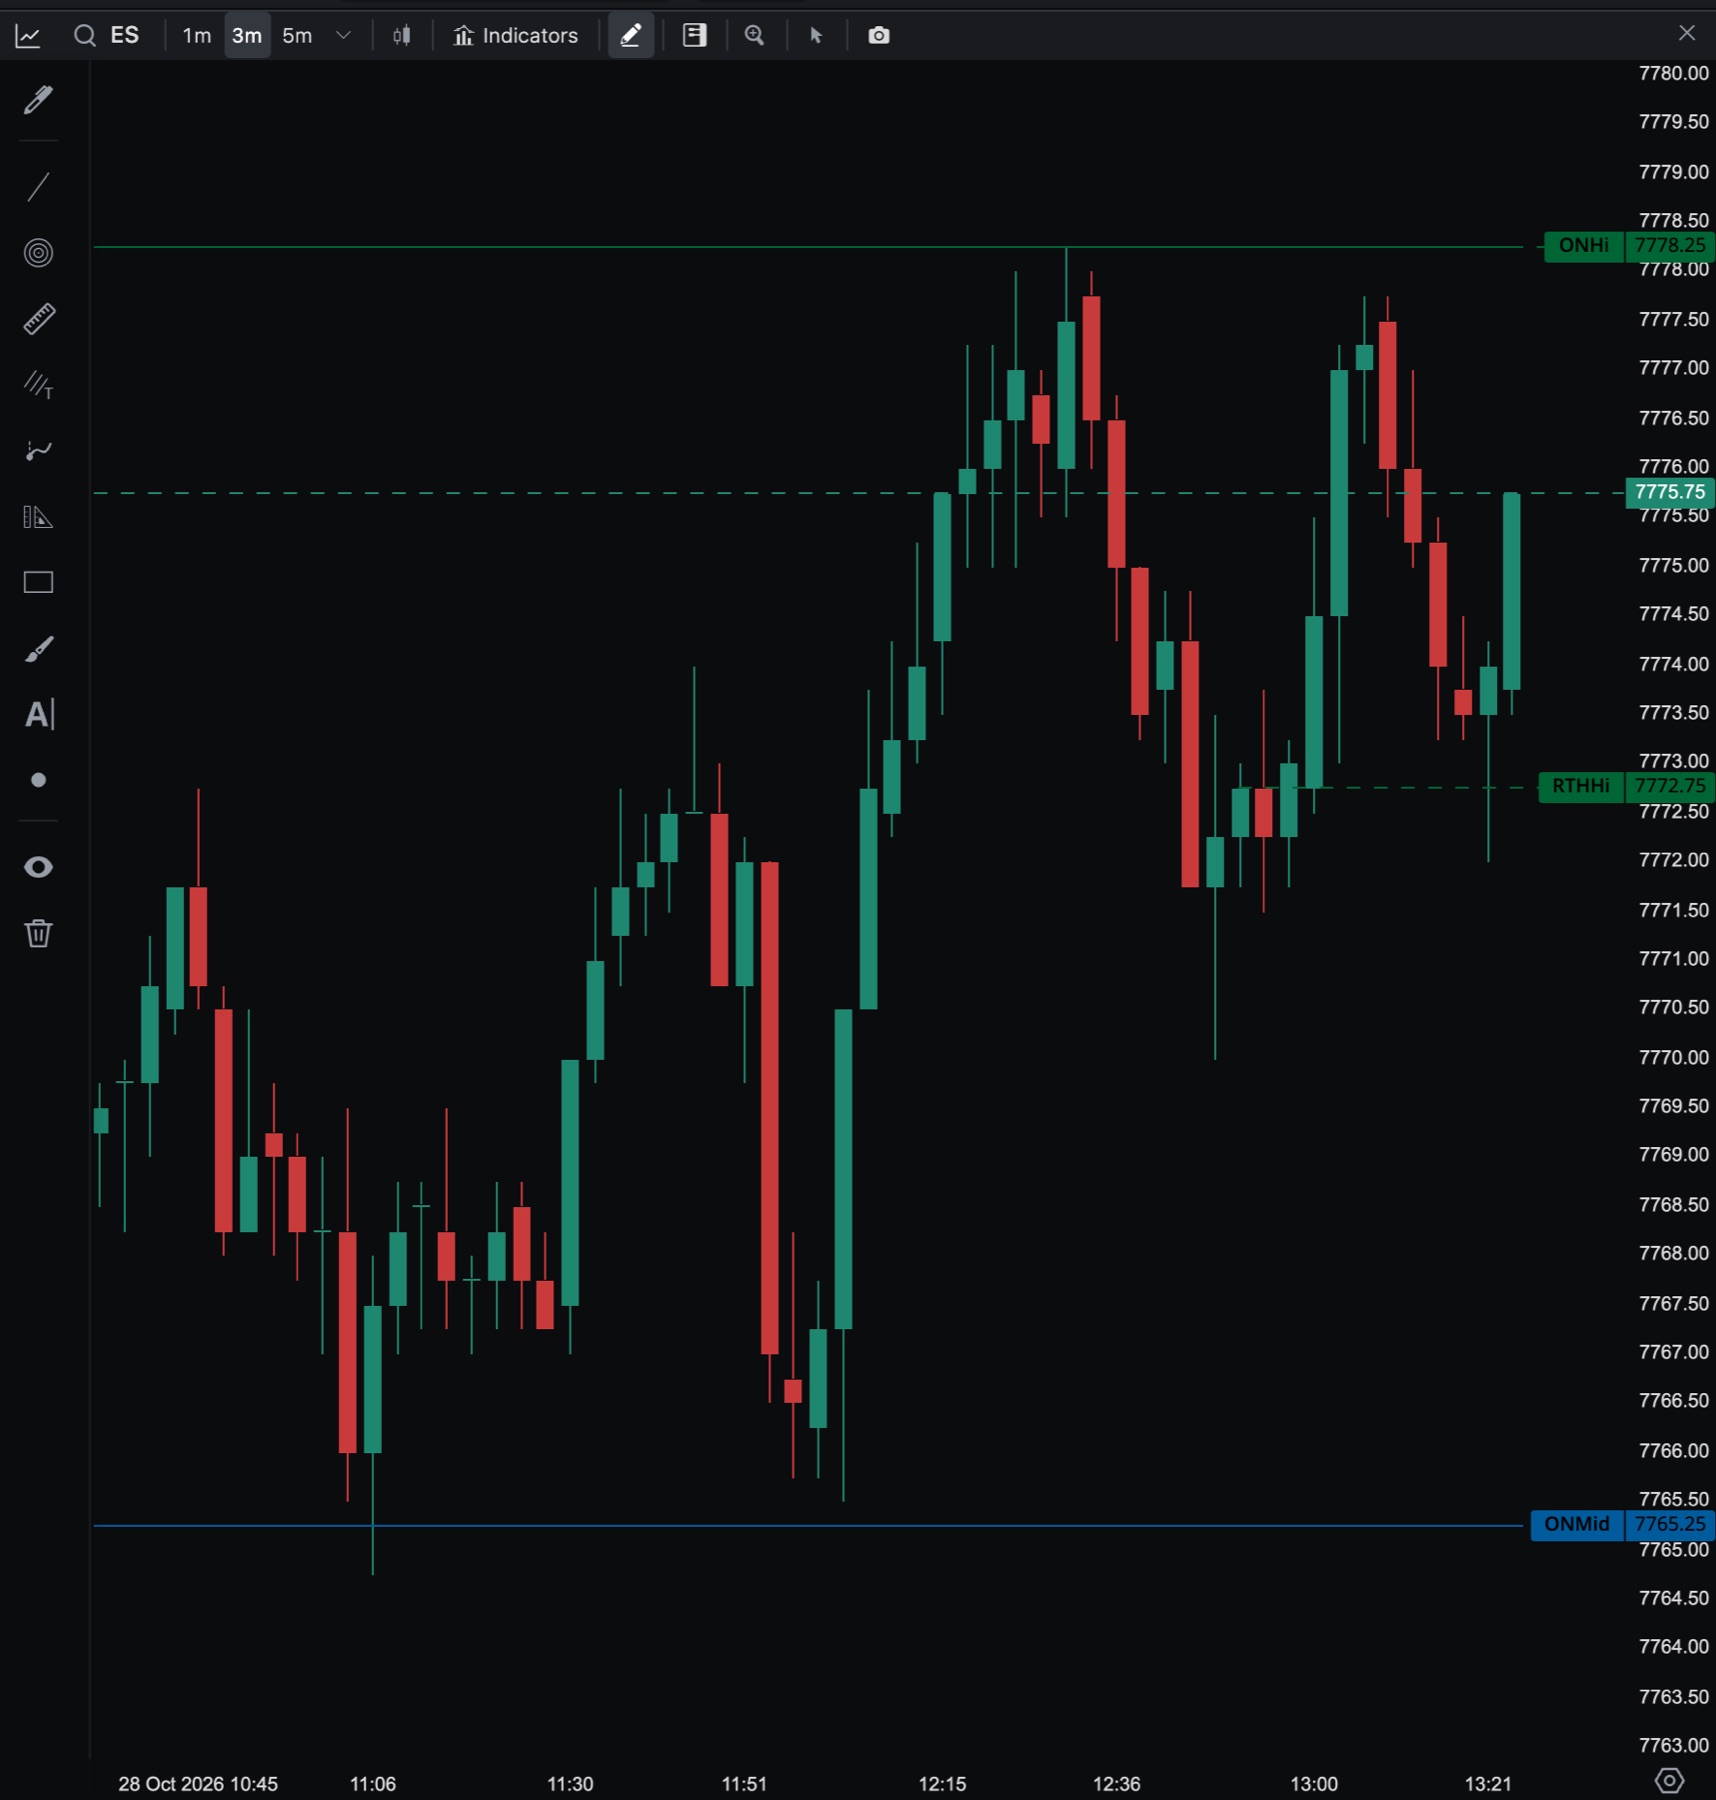
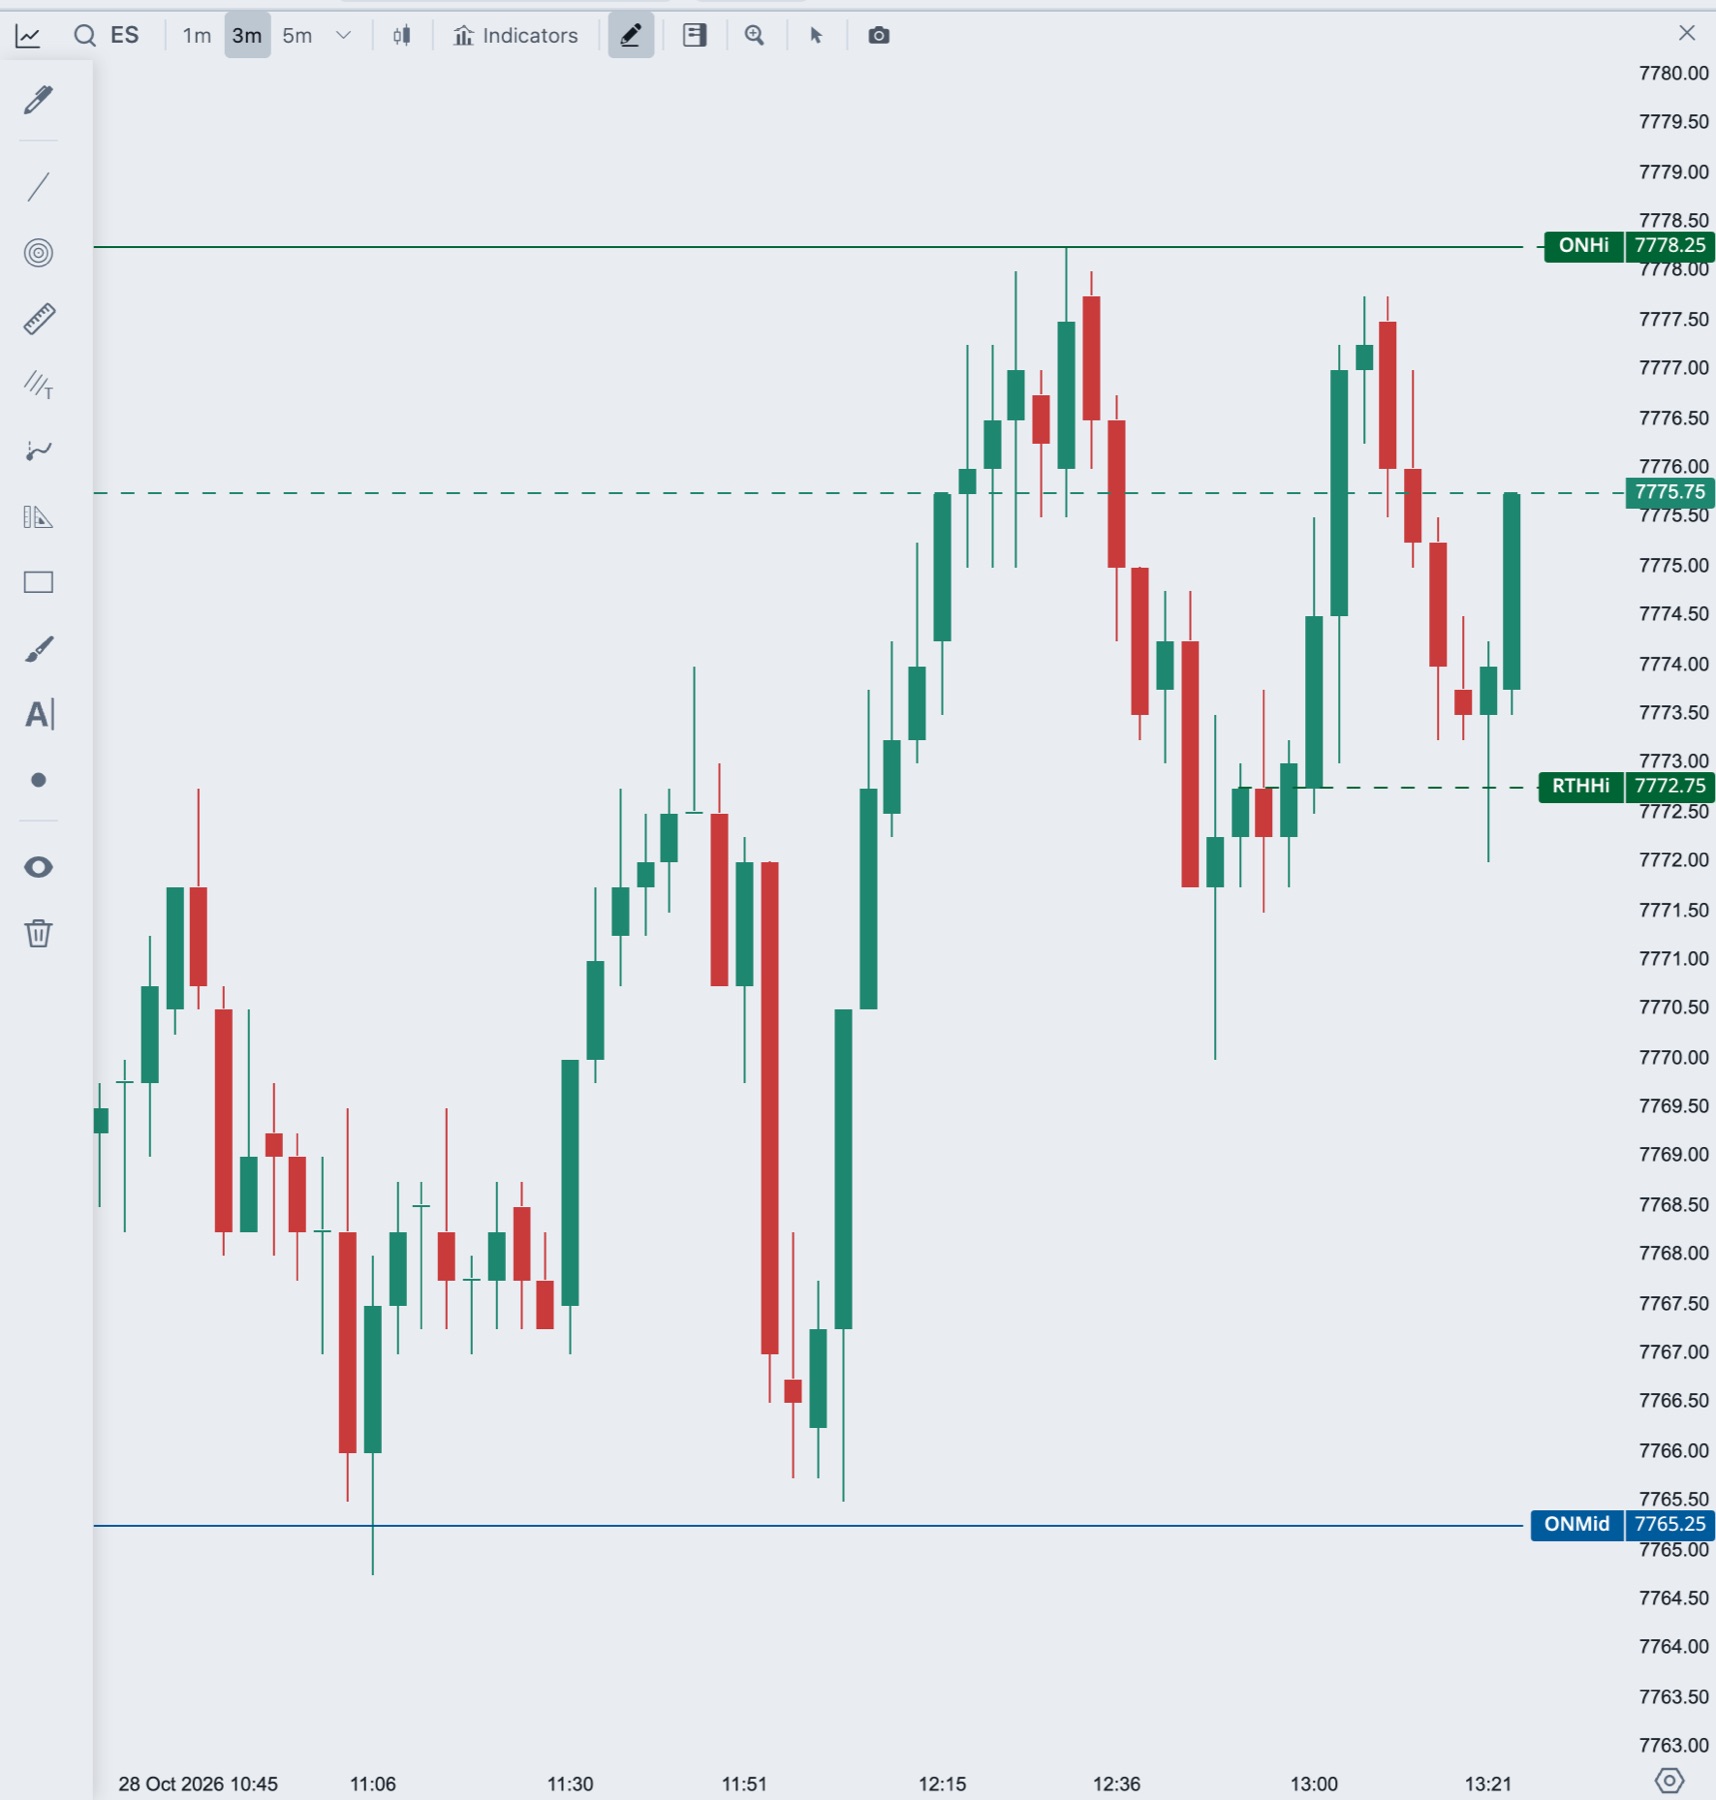
Add Session Stats to a chart
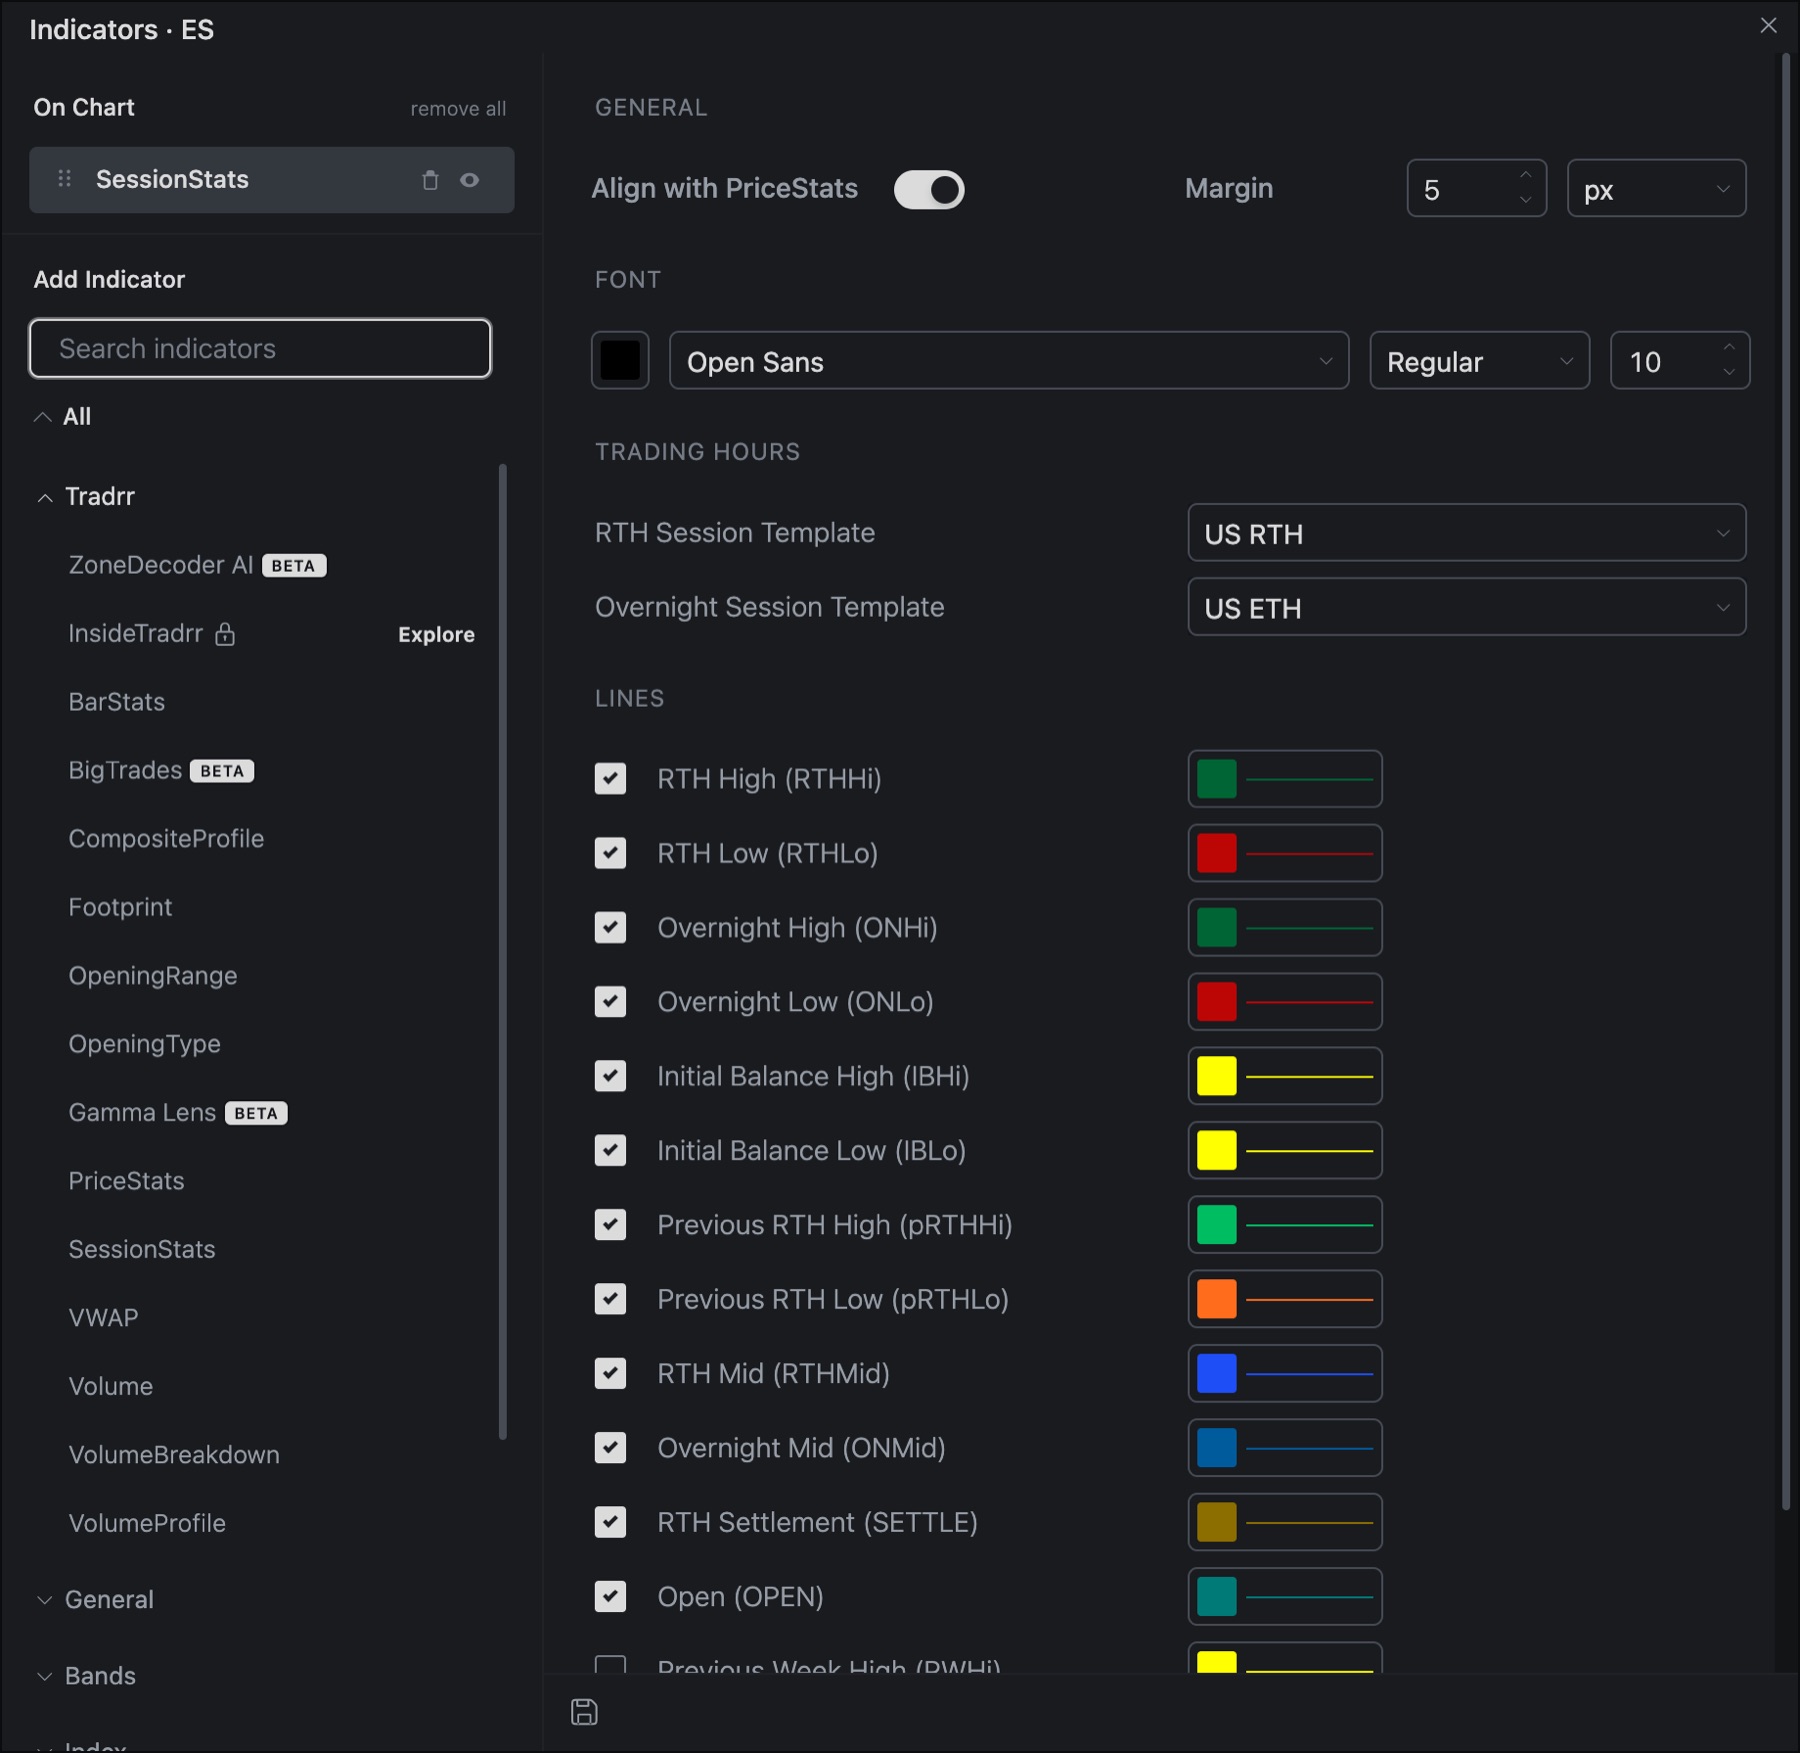
- In the chart header, click Indicators.
- Under Add Indicator, type
SessionStatsin Search indicators, or open the Tradrr group. The name has no space. - Click SessionStats in the list. It is added to the chart and its settings open on the right.
You can add one Session Stats to a chart. See Add and manage indicators for hiding, reordering and removing it.
Levels
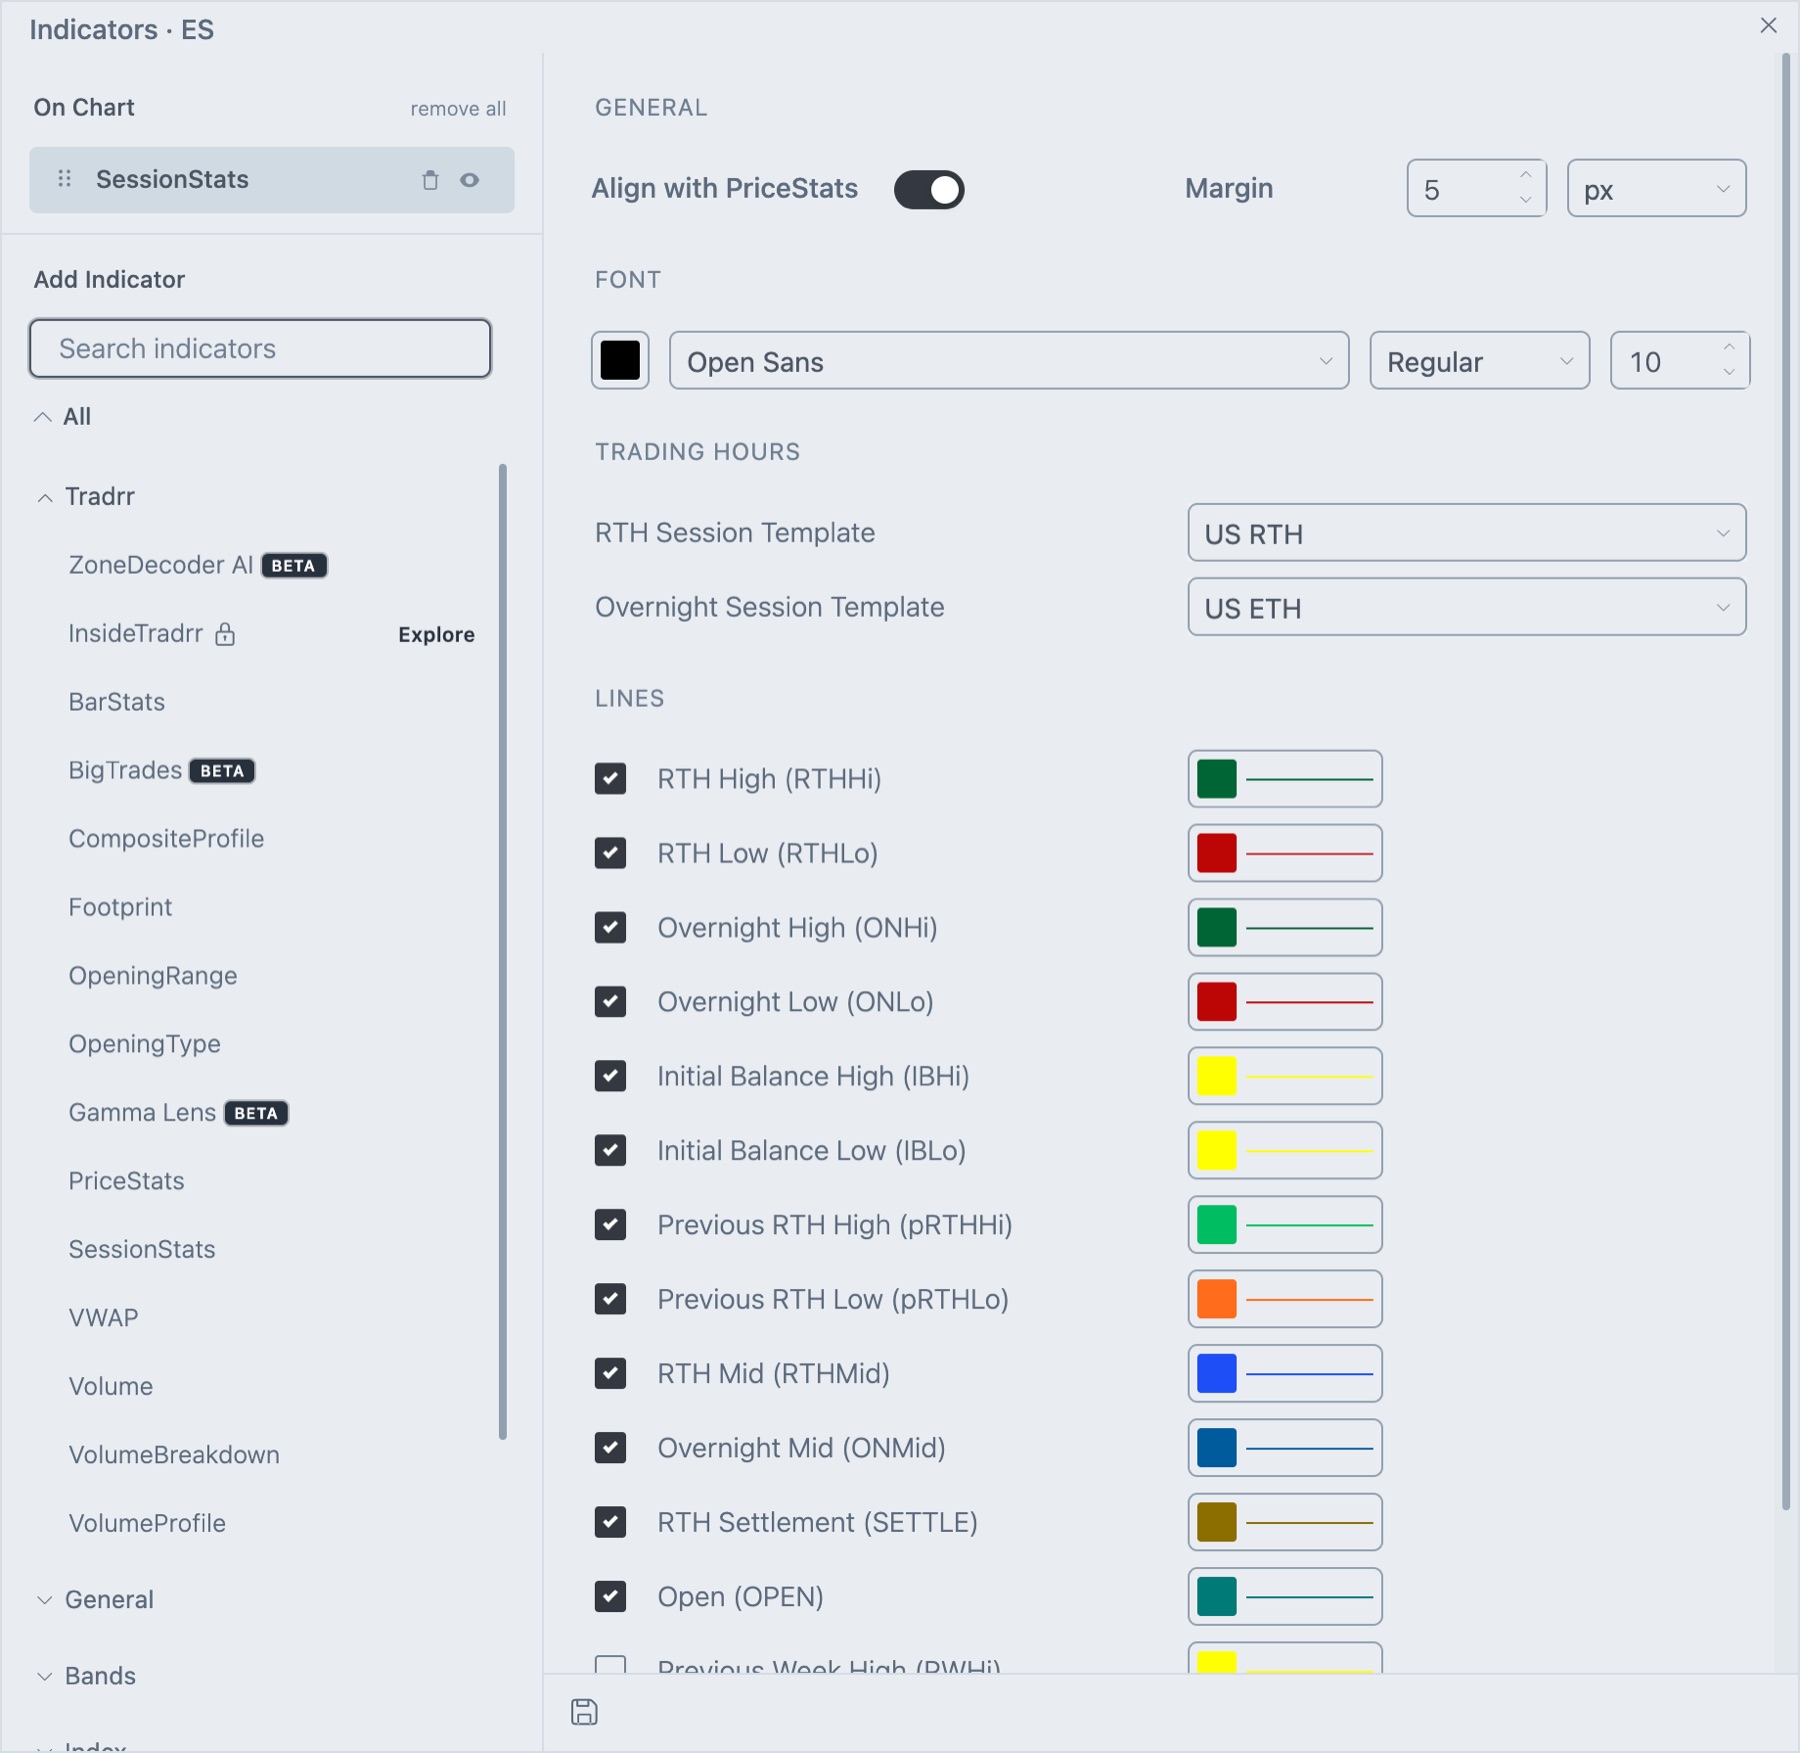
The Lines group has one row per level. Each row has a checkbox, a color and a line style. Everything is on by default except the two previous week levels.
| Setting | Chart label | On by default | What it marks |
|---|---|---|---|
| RTH High (RTHHi) | RTHHi | Yes | Highest price of the RTH session. |
| RTH Low (RTHLo) | RTHLo | Yes | Lowest price of the RTH session. |
| Overnight High (ONHi) | ONHi | Yes | Highest price of the overnight session. |
| Overnight Low (ONLo) | ONLo | Yes | Lowest price of the overnight session. |
| Initial Balance High (IBHi) | IBHi | Yes | Highest price in the first hour of the RTH session. |
| Initial Balance Low (IBLo) | IBLo | Yes | Lowest price in the first hour of the RTH session. |
| Previous RTH High (pRTHHi) | pRTHHi | Yes | Highest price of the previous RTH session. |
| Previous RTH Low (pRTHLo) | pRTHLo | Yes | Lowest price of the previous RTH session. |
| RTH Mid (RTHMid) | RTHMid | Yes | Midpoint of the RTH high and low. |
| Overnight Mid (ONMid) | ONMid | Yes | Midpoint of the overnight high and low. |
| RTH Settlement (SETTLE) | SETTLE | Yes | Settlement price of the previous RTH session. If no official settlement is available, the last close of that session. |
| Open (OPEN) | OPEN | Yes | Opening price of the RTH session. |
| Previous Week High (PWHi) | PWHi | No | Highest price of the previous week. |
| Previous Week Low (PWLo) | PWLo | No | Lowest price of the previous week. |
All lines start solid and one pixel wide, each in its own color. The high levels are green, the low levels red, and the initial balance and previous week levels yellow. Change a color or line style on its row.
Settings
General
| Setting | What it does | Default |
|---|---|---|
| Align with PriceStats | Ends the level lines where the Price Stats profiles begin, so the two do not overlap. | On |
| Length | Length of the line drawn at the price scale, in px or %. Hidden while Align with PriceStats is on. | 200 px |
| Margin | Gap between the lines and the edge of the chart, in px or %. | 5 px |
Font
| Setting | What it does | Default |
|---|---|---|
| Color swatch | Color of the label text. | Black |
| Font family | Open Sans, Monospace or Sans Serif. | Open Sans |
| Font weight | Regular or Bold. | Regular |
| Font size | Size of the label text. | 10 |
Trading Hours
| Setting | What it does |
|---|---|
| RTH Session Template | The session used for the RTH, initial balance, OPEN, mid and previous-session levels. |
| Overnight Session Template | The session used for the overnight levels. |
The templates come from your session list. See Session Manager to create or edit one.
How traders read it
- Overnight high and low: the range traded before the open. Many traders watch for a break of
ONHiorONLoshortly after RTH starts. - Previous RTH high and low: the prior day's extremes, often used as targets or as levels to fade.
- Initial balance: the first hour sets the early range. A move beyond
IBHiorIBLoshows that one side has taken control. - Mid levels: the halfway point of a session. Price often reacts here when it returns to the middle of the range.
Tip. Turn on only the levels you trade. Fourteen labels on one chart crowd the price scale. Start with ONHi, ONLo, RTHHi and RTHLo.
Related articles
Was this article helpful?