Volume Breakdown
Volume Breakdown splits each bar's volume by side and plots the result in a panel below the price chart. Use it to see whether buyers or sellers were more aggressive, bar by bar or accumulated across a session.
- Shows
- Delta, delta bars, delta momentum, buy volume or sell volume
- Resets
- With Accumulate on: each session, week or month
- Best on
- Time charts
What it measures
Every trade is counted as a buy when it traded at the ask, or as a sell when it traded at the bid. For each bar, Volume Breakdown adds these up across all the bar's prices.
- Delta: a column per bar. Up columns mean more buying than selling. Down columns mean more selling.
- Delta Bars: candle-style bars of delta. Each bar opens at the previous value and closes at the current one.
- Delta Momentum: a column that adds up delta over the run of consecutive bars with the same sign, so a streak of buying shows as one growing value.
- Buy Volume and Sell Volume: one column per bar with only the buy or only the sell side.
The type setting chooses what is counted: contracts (Volume) or number of trades (Ticks).
With Accumulate on, each bar's value is added to the total since the start of the session, week or month, or since the start of the loaded data. With Delta Bars this gives a cumulative delta line drawn as bars that restarts at each session.
On the chart
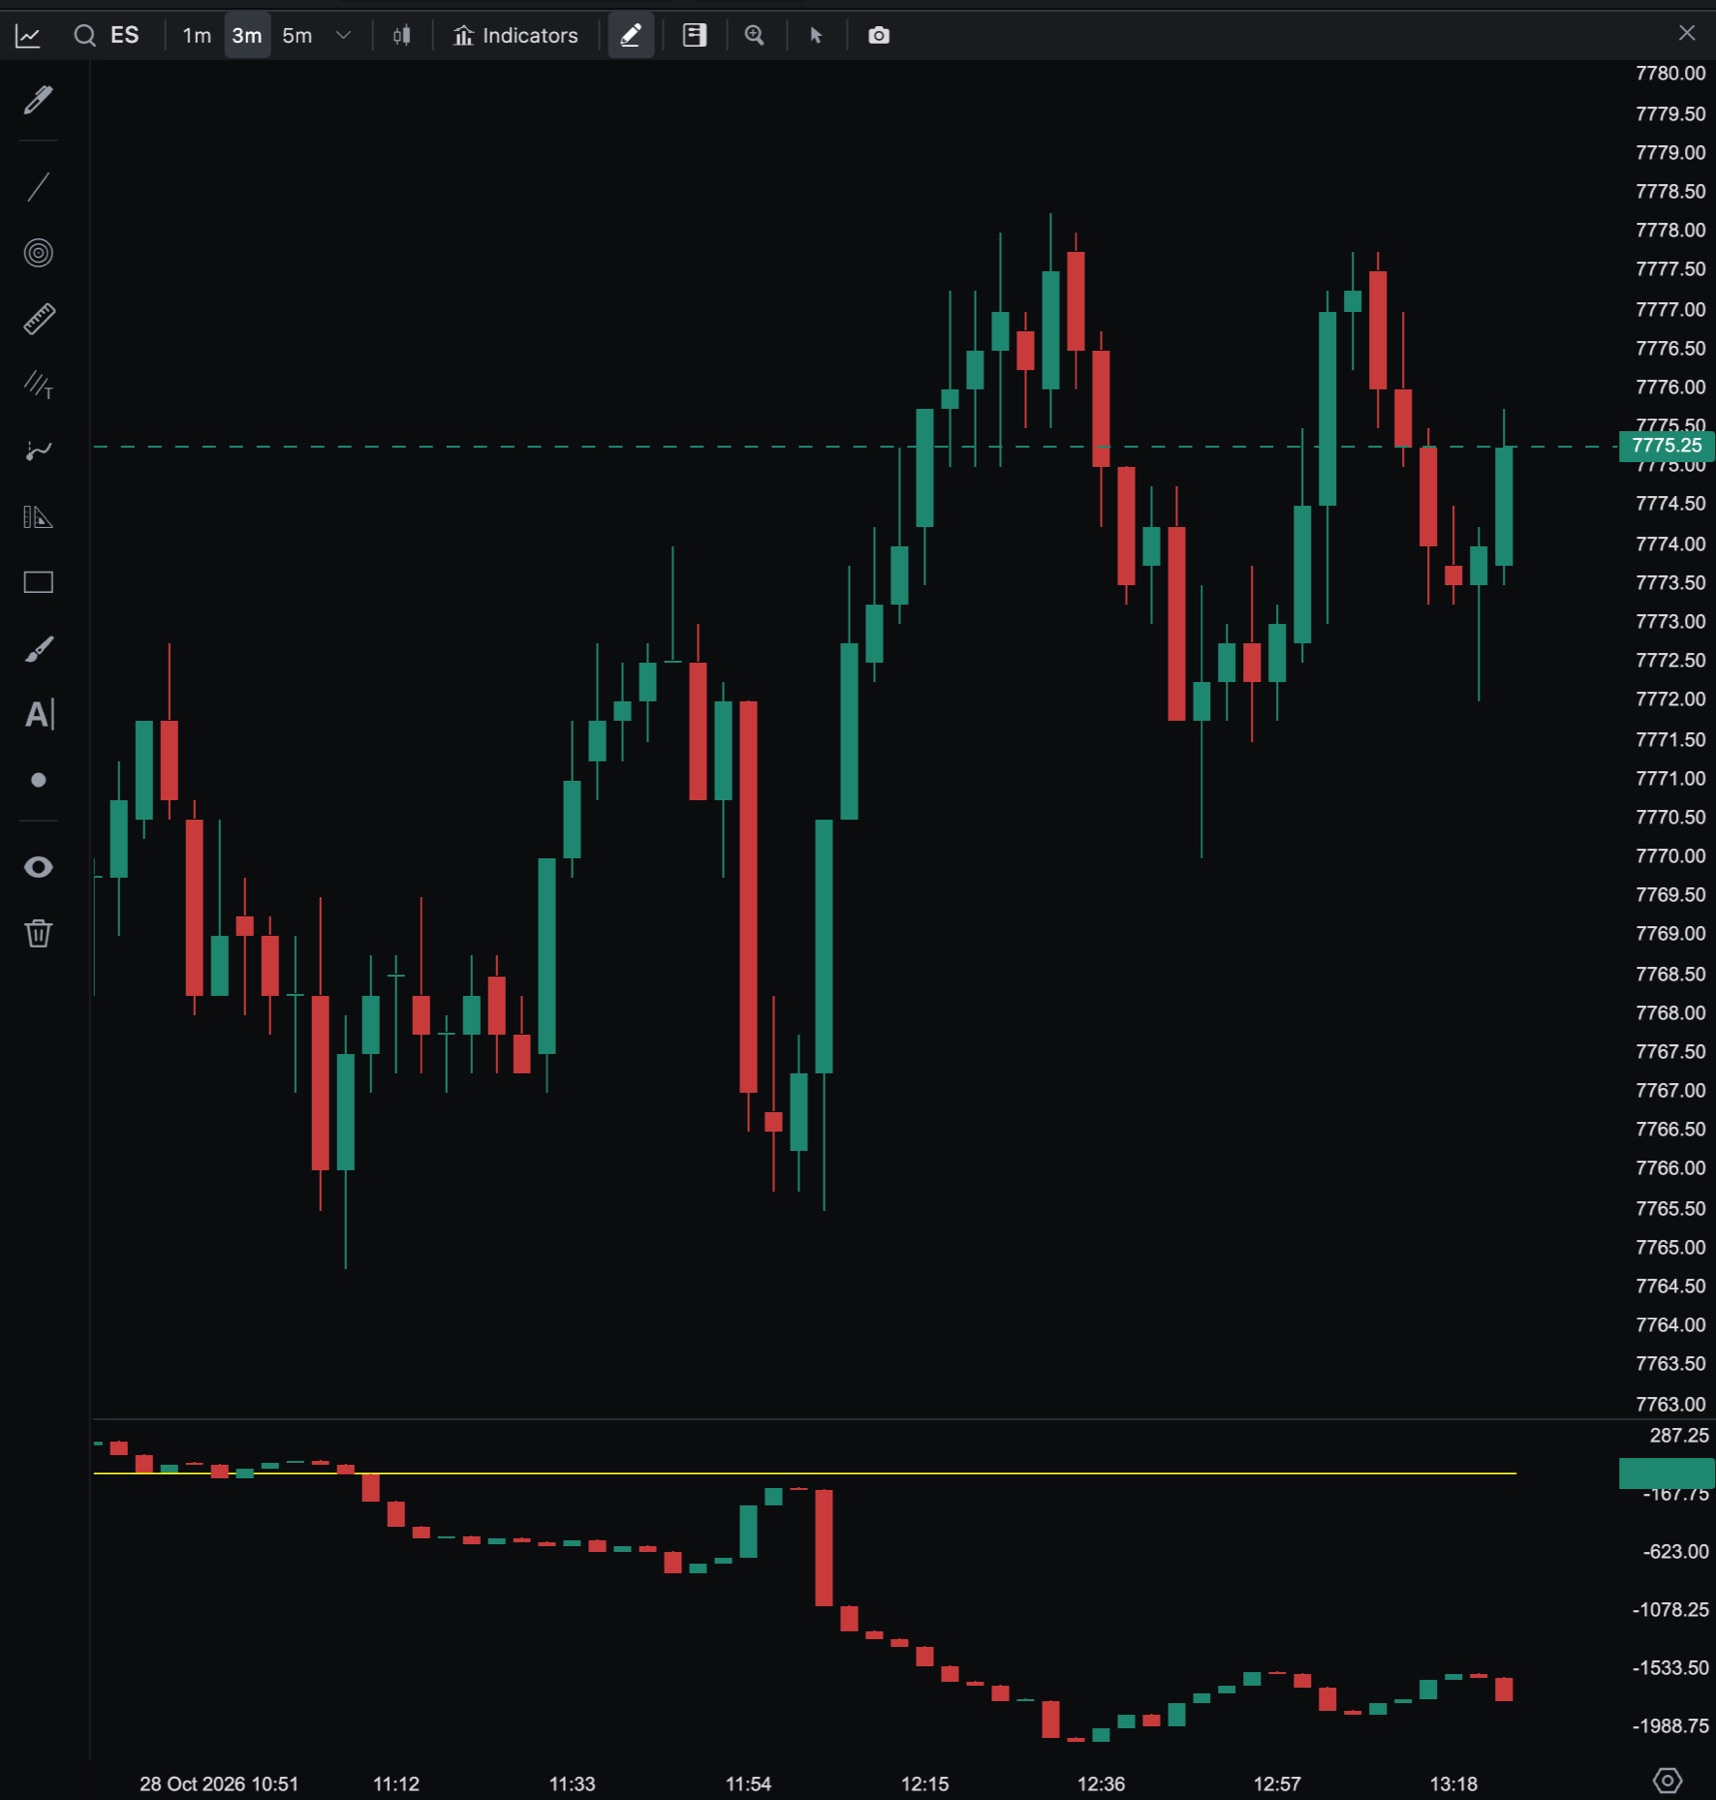
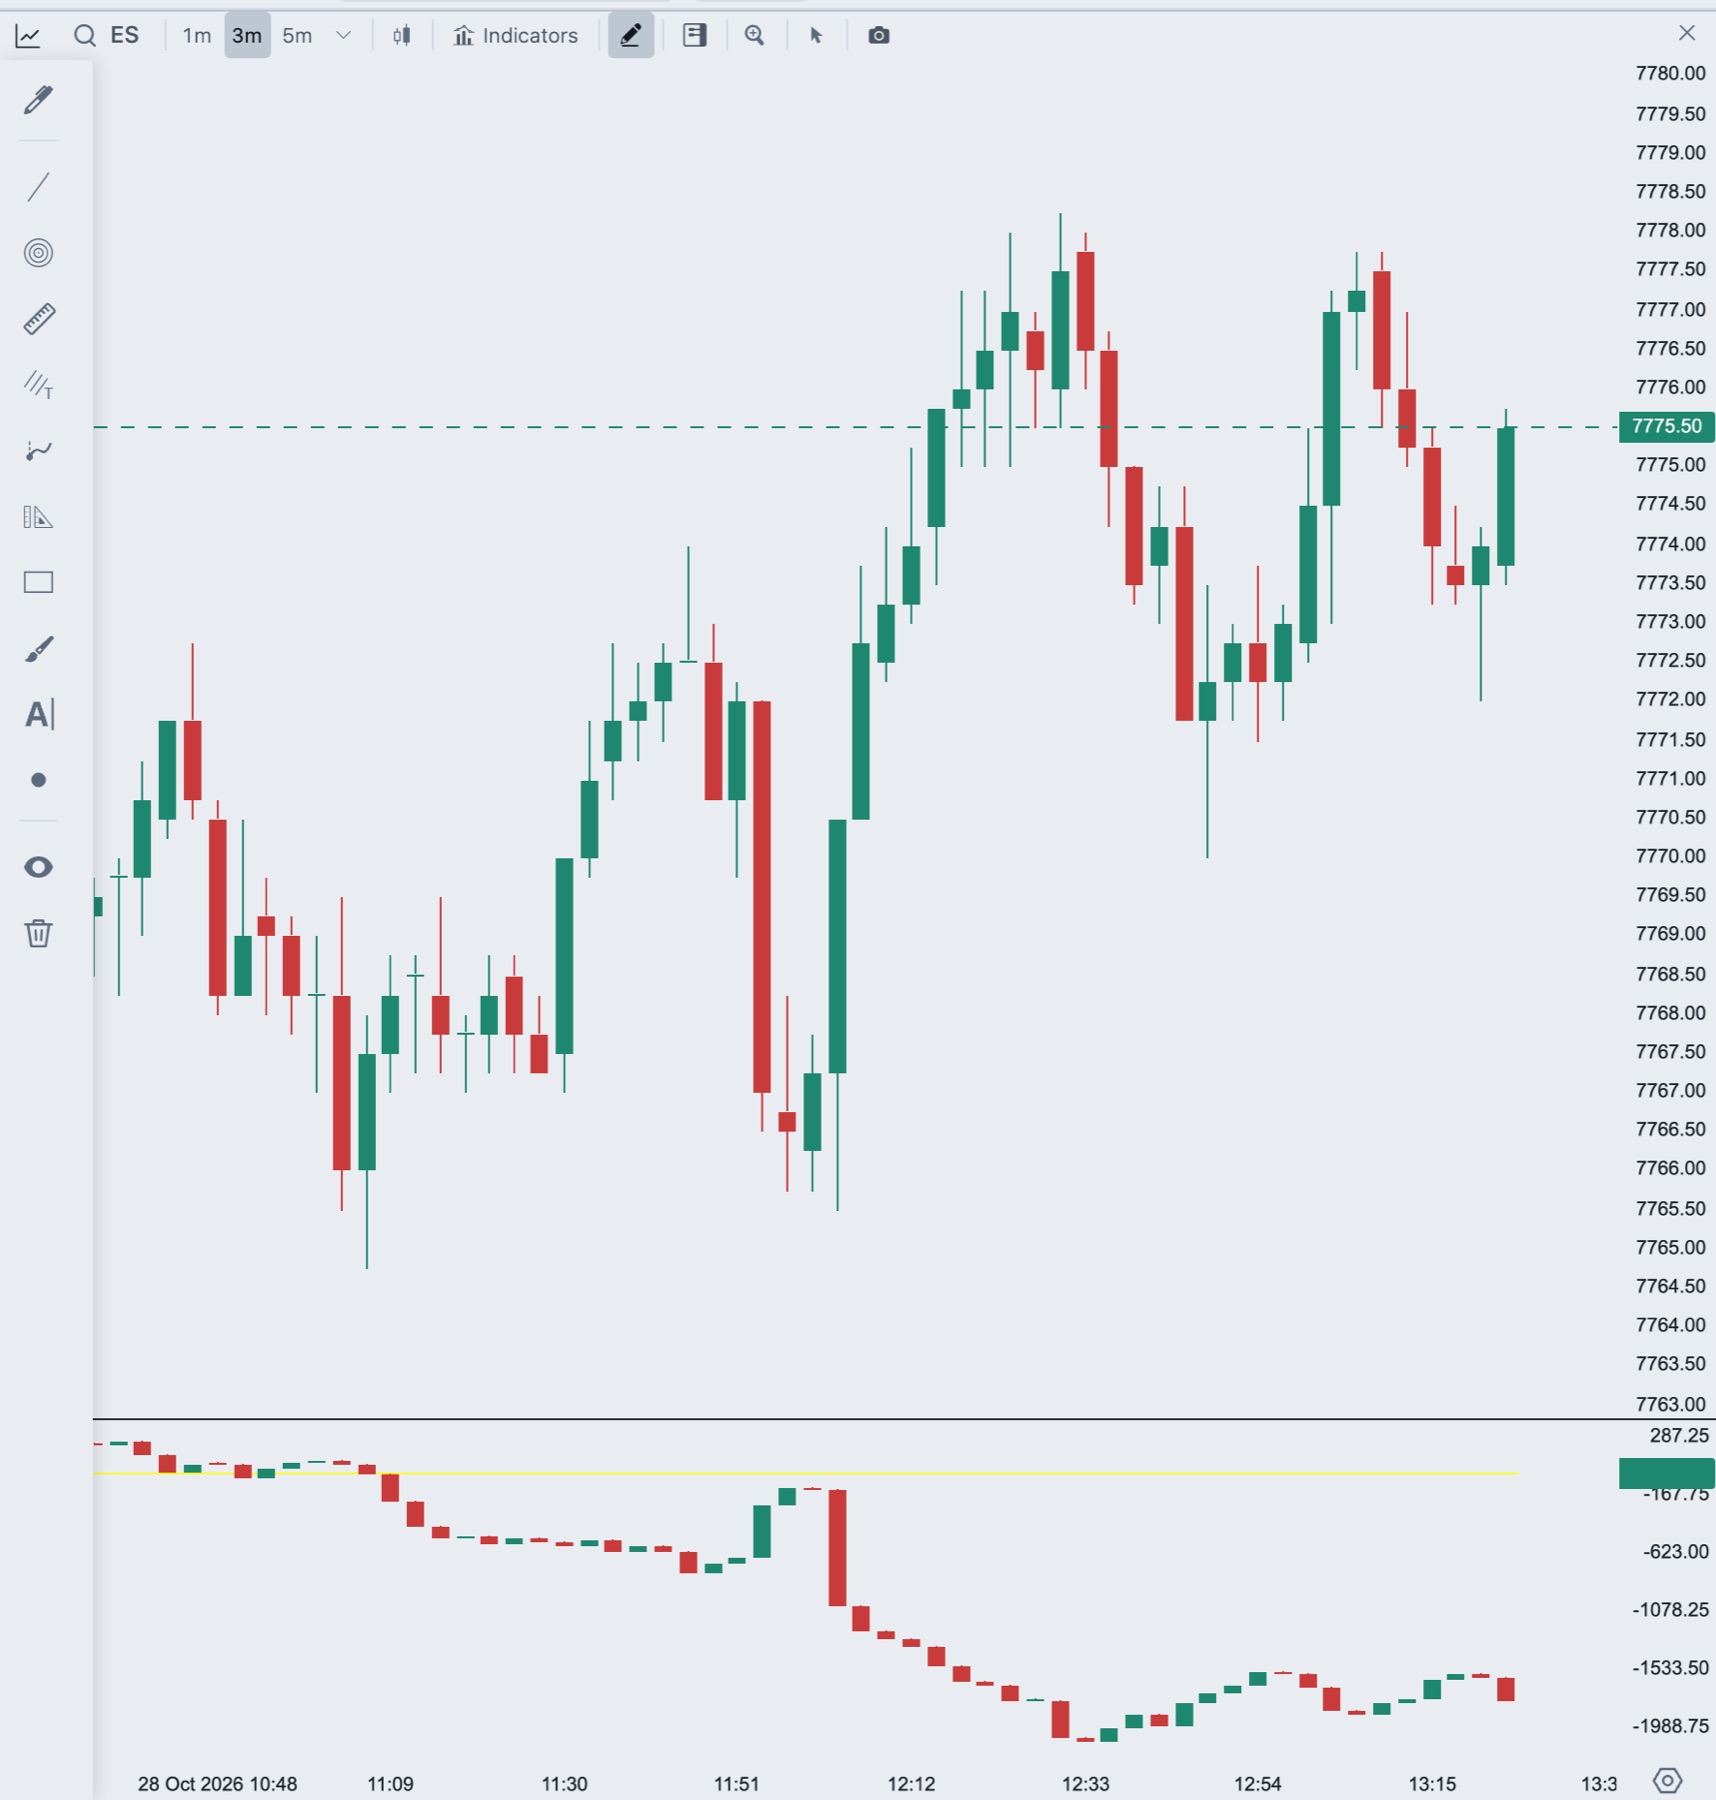
Add Volume Breakdown to a chart
- In the chart header, click Indicators.
- Type
breakdownin Search indicators and click VolumeBreakdown. - Choose a Mode and decide whether to turn on Accumulate.
Volume Breakdown allows one copy per chart.
Settings
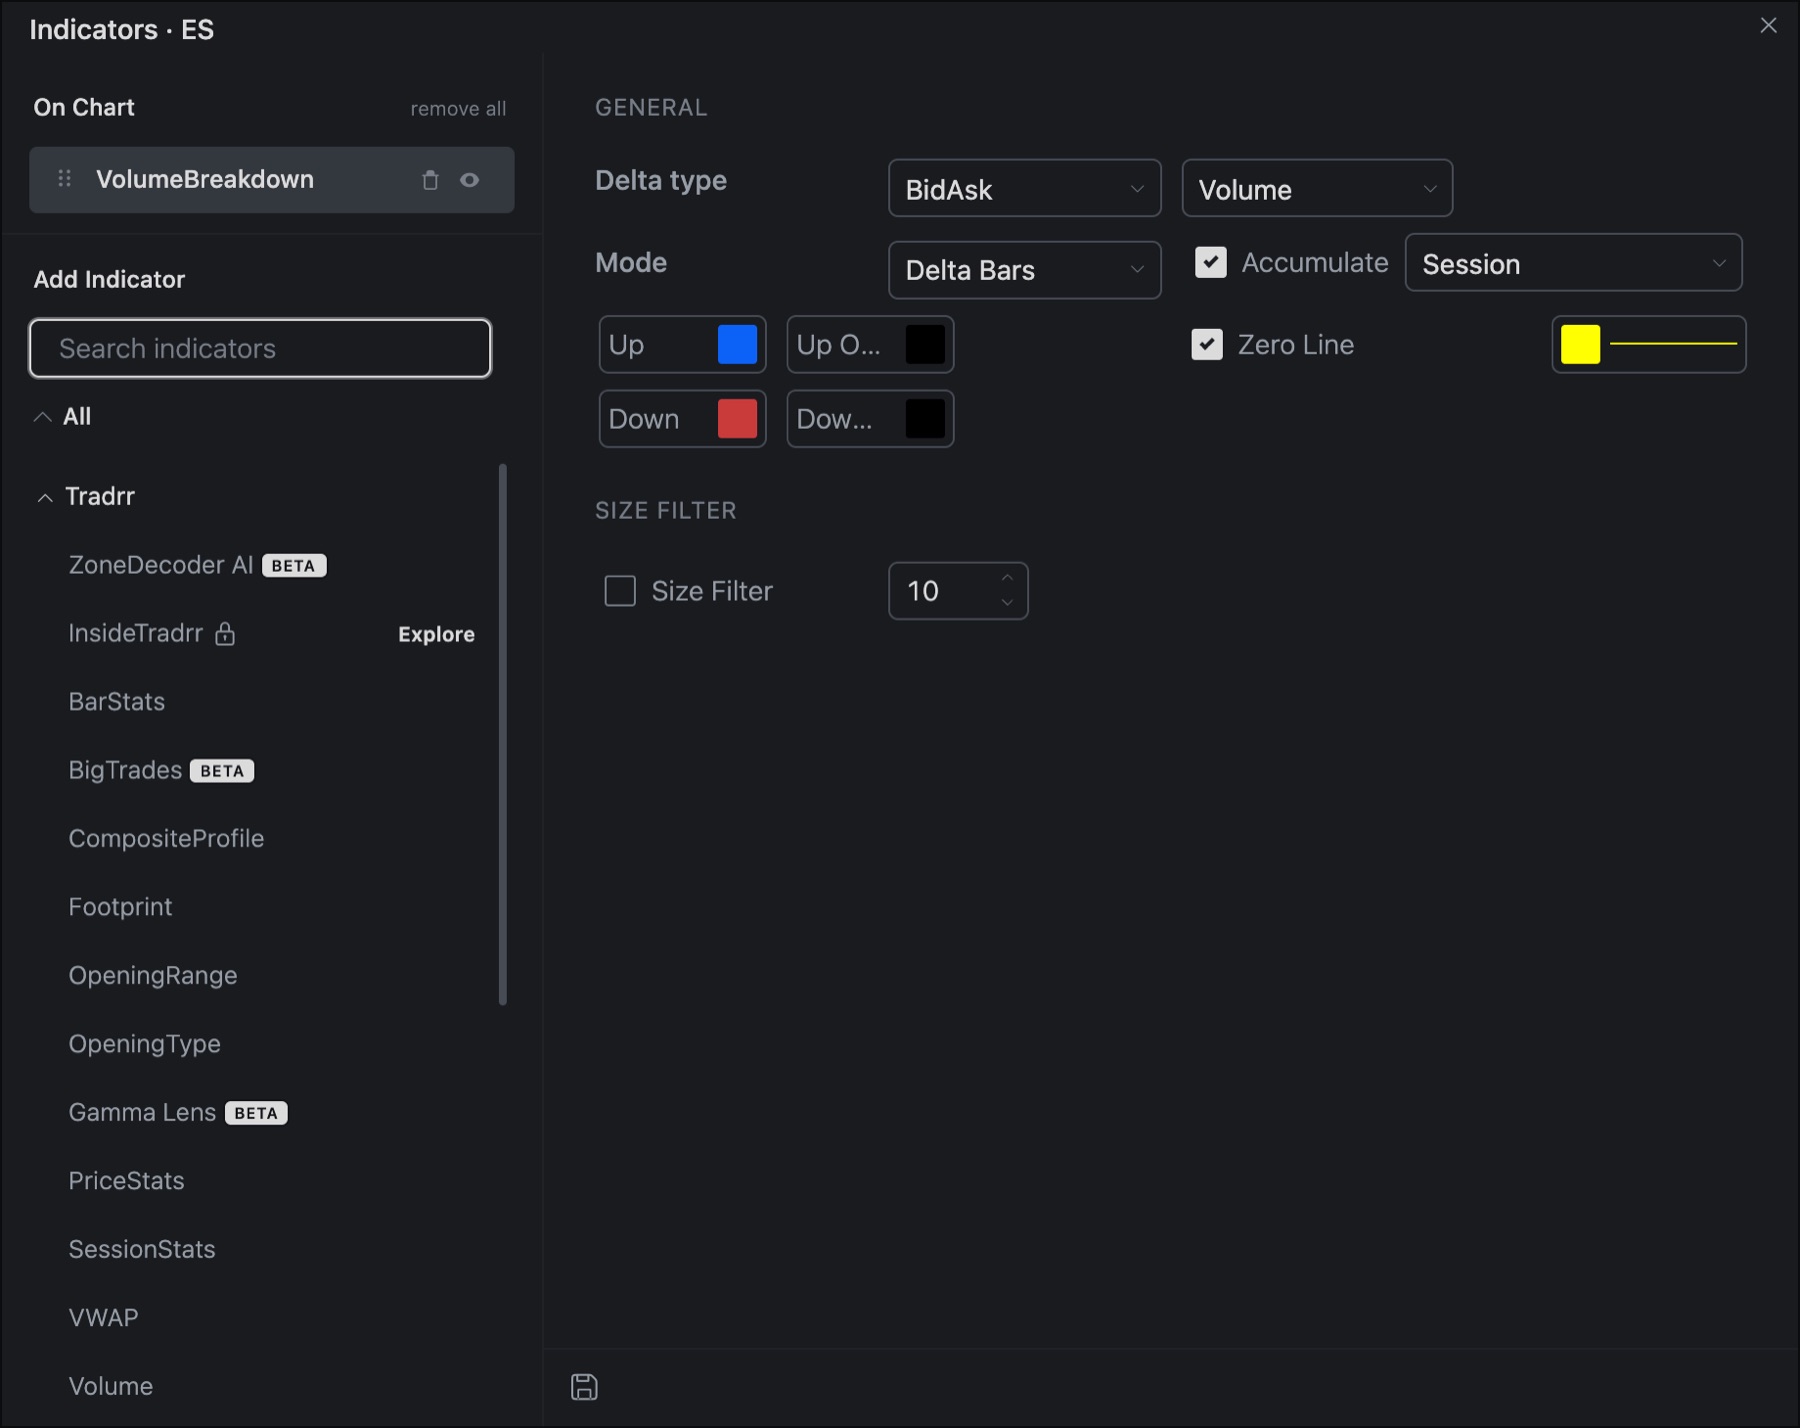
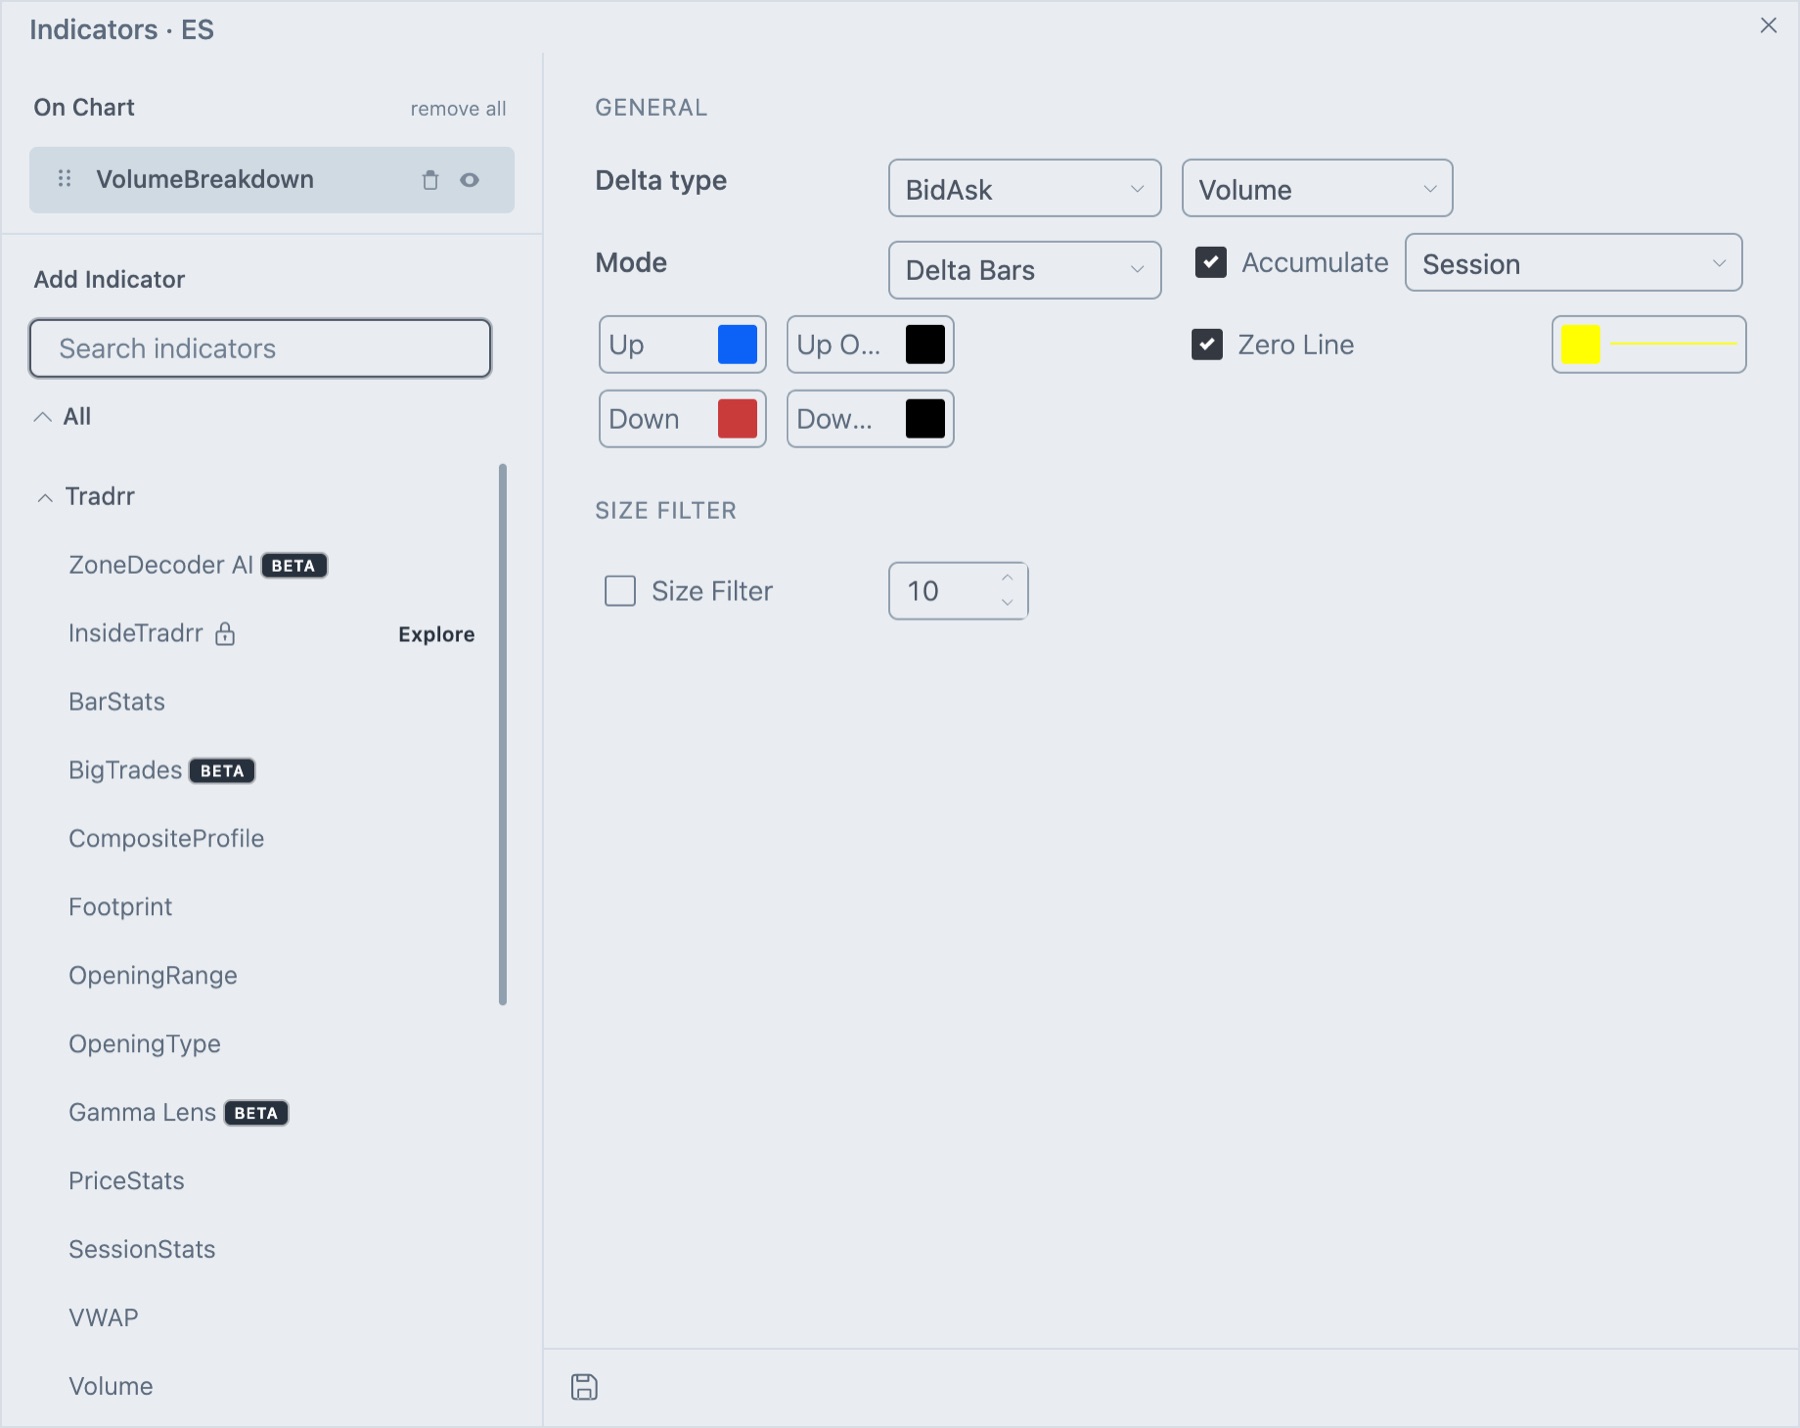
General
| Setting | What it does | Default |
|---|---|---|
| Delta type | How buys and sells are told apart. The only choice is BidAsk: trades at the ask are buys and trades at the bid are sells. | BidAsk |
| Volume or Ticks | The second select on the Delta type row. Volume counts contracts. Ticks counts trades. | Volume |
| Mode | Delta (Buy - Sell Volume), Delta Bars, Delta Momentum, Buy Volume or Sell Volume. | Delta Bars |
| Accumulate | Adds each bar to a running total. Choose Session, Week, Month or All Values for when the total restarts. | On, Session |
| Up, Up Outline | Fill and outline colors for positive values. | Green, black |
| Down, Down Outline | Fill and outline colors for negative values. | Red, black |
| Zero Line | Draws a line at zero. Set its color and line style beside the box. | On, yellow |
Size Filter
| Setting | What it does | Default |
|---|---|---|
| Size Filter | Tick the box and enter a number. In the column modes, bars whose value is larger than the number, up or down, are not drawn. Use it to hide extreme bars that squash the rest of the panel. It does not apply to Delta Bars. | Off, 10 |
How traders read it
- Cumulative delta rising with price: buying is driving the move.
- Price rising while cumulative delta falls: the move is not backed by aggressive buying, which some traders treat as a warning.
- A large delta bar at a high or low: aggressive trading there, with price unable to continue, can mark exhaustion.
- Delta Momentum streaks: a long streak shows one side staying in control across bars.
Related articles
Was this article helpful?