Footprint
Footprint replaces each candle with a grid of numbers. For every price inside the bar, it shows how much traded at the bid and how much traded at the ask. That shows you where buyers and sellers were active.
- Shows
- Bid and ask volume at each price inside every bar
- Updates
- Live, as trades arrive in the current bar
- Best on
- Time charts, zoomed in on a few bars
What it measures
Each row of a bar is one price level. Trades that hit the bid (sellers) are counted on the bid side. Trades that lift the ask (buyers) are counted on the ask side. The bid sits on the left and the ask on the right.
- Delta is ask volume minus bid volume. A positive delta means buyers were more aggressive at that price.
- Point of control (POC) is the price with the most volume. Footprint outlines the busiest price of each bar.
- Imbalance compares one side of a price with the opposite side at the neighboring price. When one side is several times bigger, Footprint marks it with a colored number, a box, or both.
On the chart
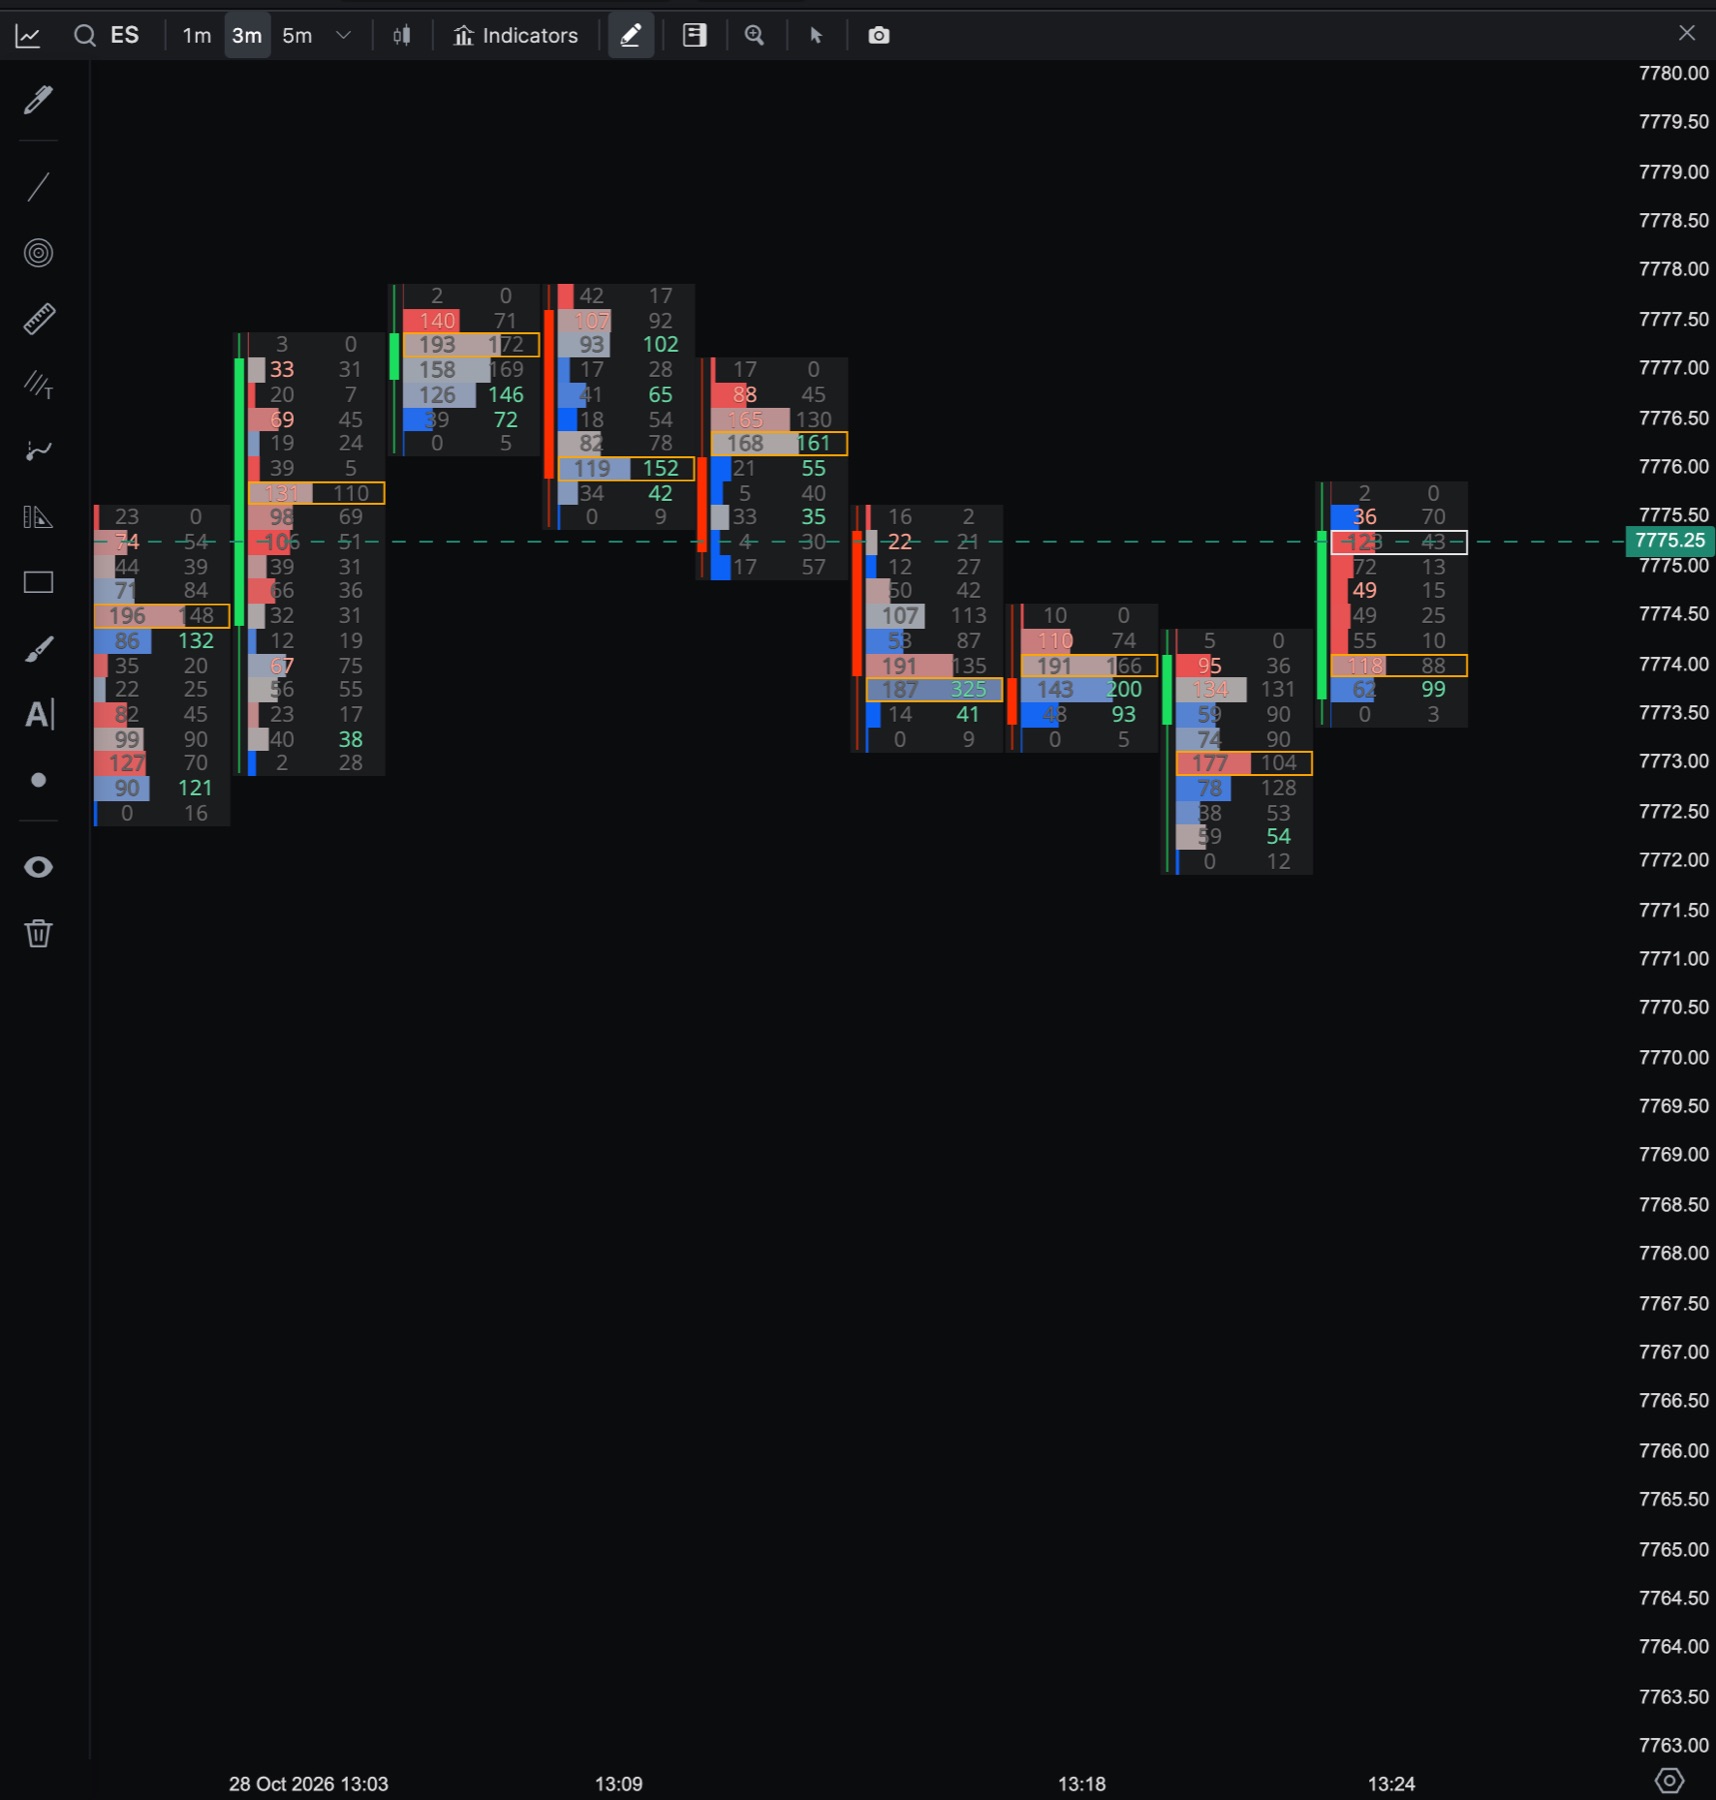
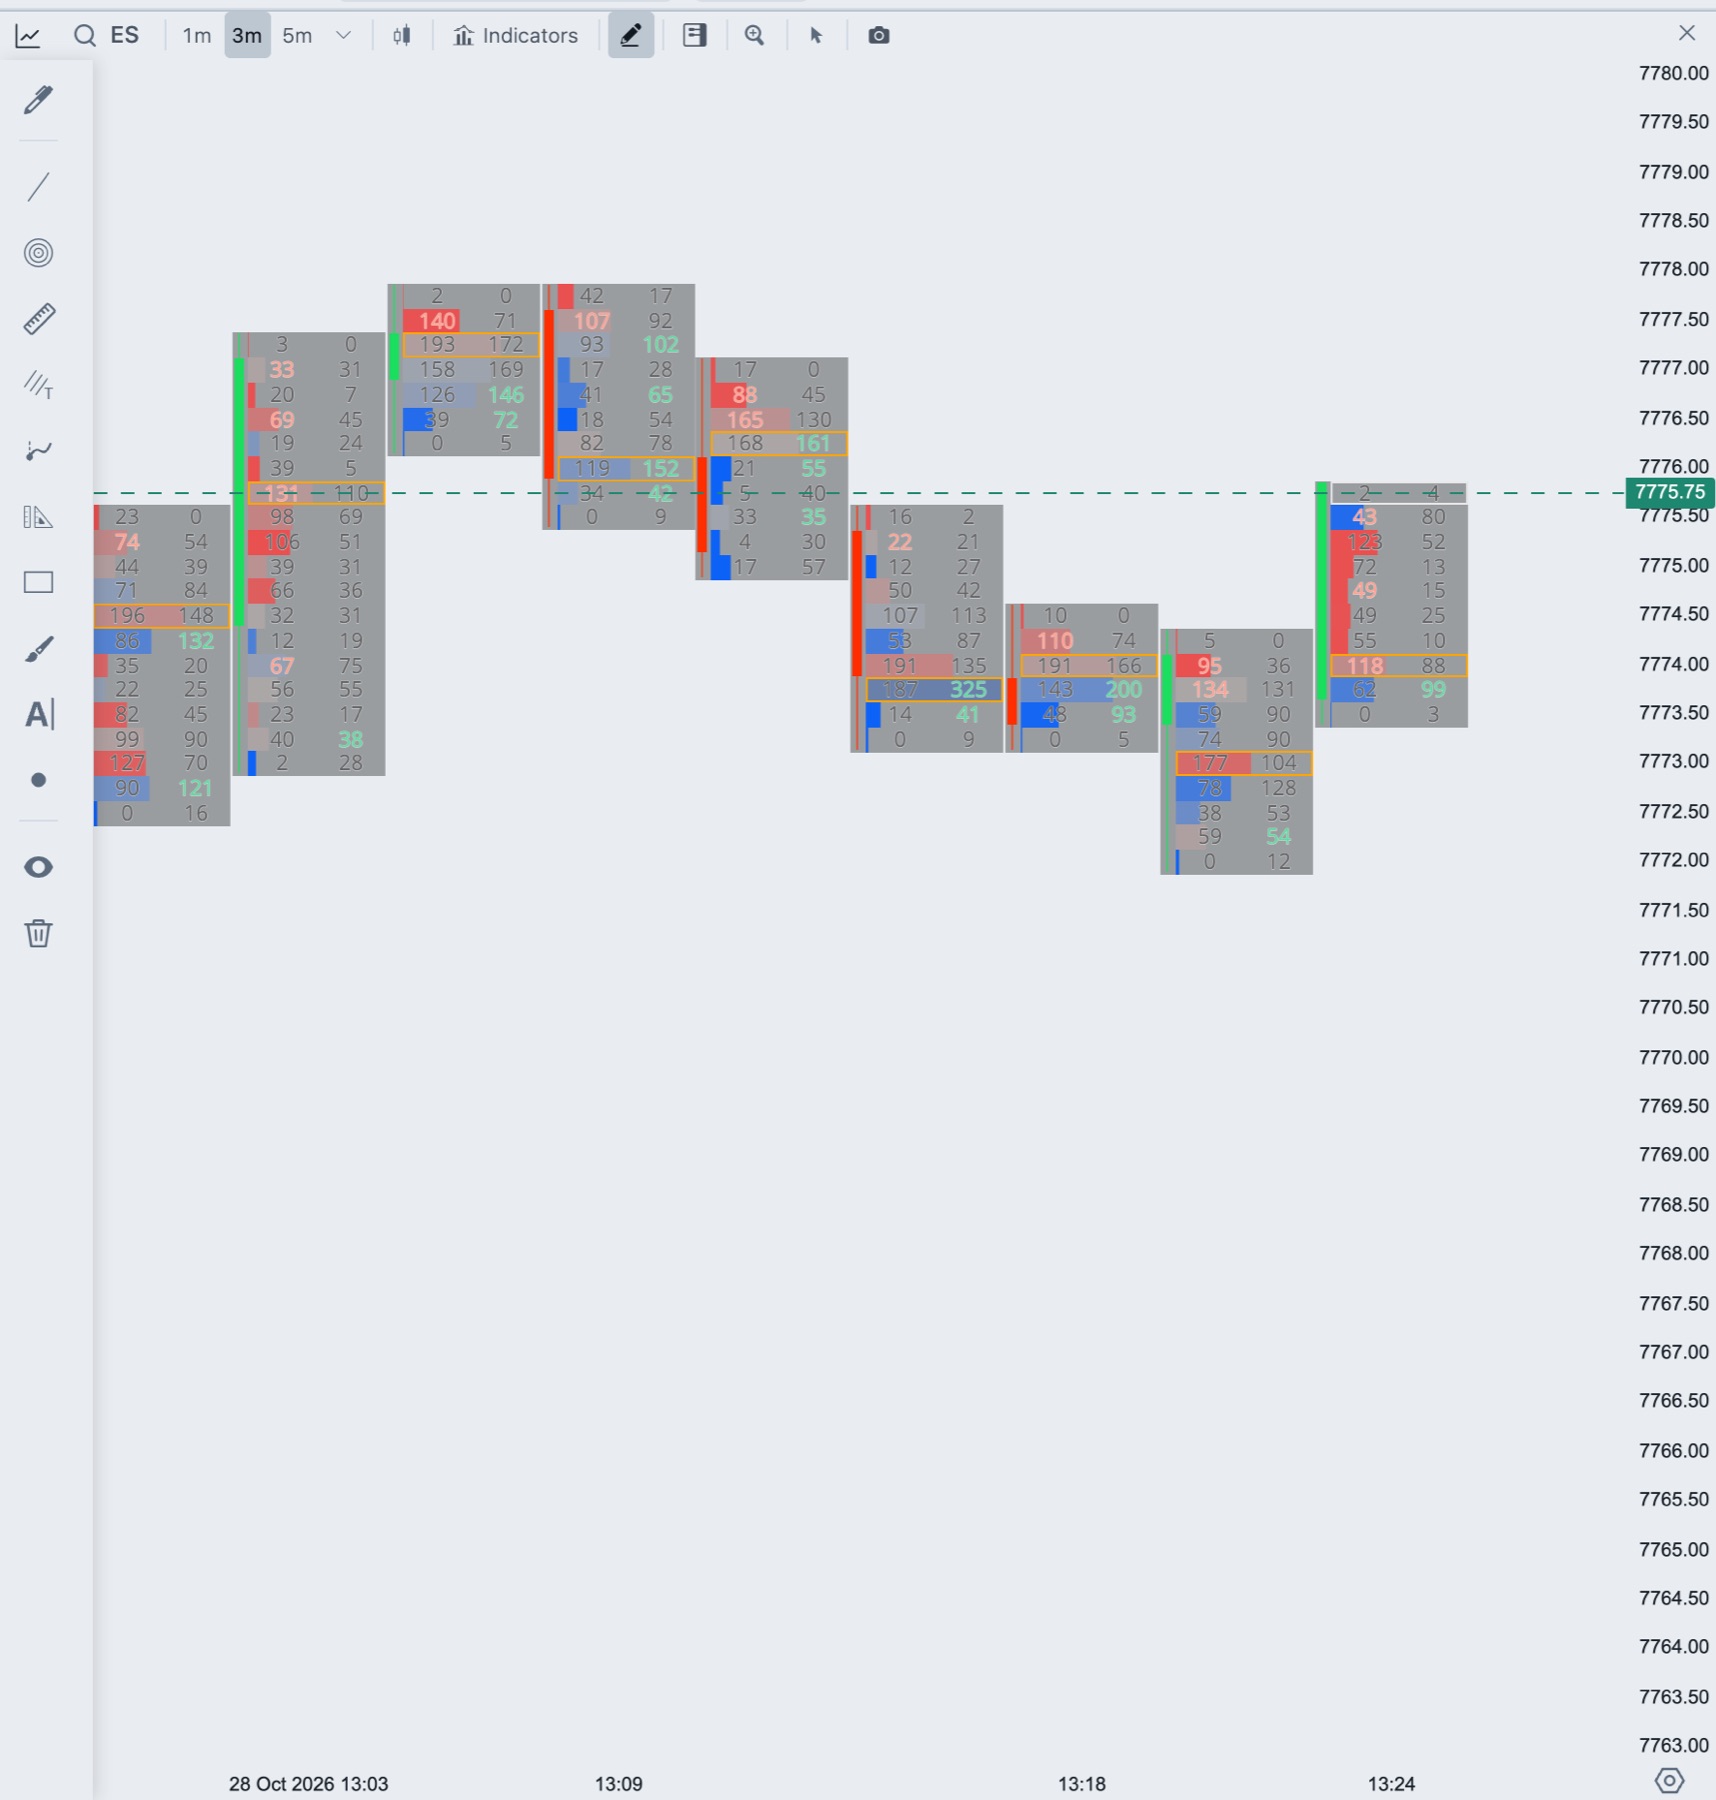
Footprint draws only when each bar is wide enough, at least 16 pixels. When you zoom out past that, the normal candles come back, and Footprint returns when you zoom in. Numbers need more room: they hide when a bar is narrower than Hide numbers when bar is narrower than, px or a row is shorter than Hide numbers when row is shorter than, px. Both are under Advanced.
Add Footprint to a chart
- In the chart header, click Indicators.
- Click Footprint in the Tradrr group.
- Pick a style and change the settings on the right.
Footprint allows one copy per chart and is not available on tick charts. When you add it, the chart zooms so each bar is about Starting bar width, px pixels wide (80 by default).
Footprint magnifier
When bars are too narrow to read, use the magnifier.
- Click the chart window so it is active, then press M.
- Move the pointer over the candles. A lens shows the candles around the pointer, three of them, or four when there is room.
- Press M or Esc again, or click the X on the lens, to turn it off.
The lens puts the candles on one shared price scale. Each row shows bid volume on the left and ask volume on the right, the busiest row is outlined, and the delta of each candle is listed under it. If there are too many prices to fit, rows combine several ticks and the footer shows the number of ticks per row. An asterisk marks a candle with partial bid and ask data, and No bid/ask means none is loaded for that candle. The lens hides while you press the mouse, scroll or leave the chart. The magnifier does not need Footprint on the chart.
Settings
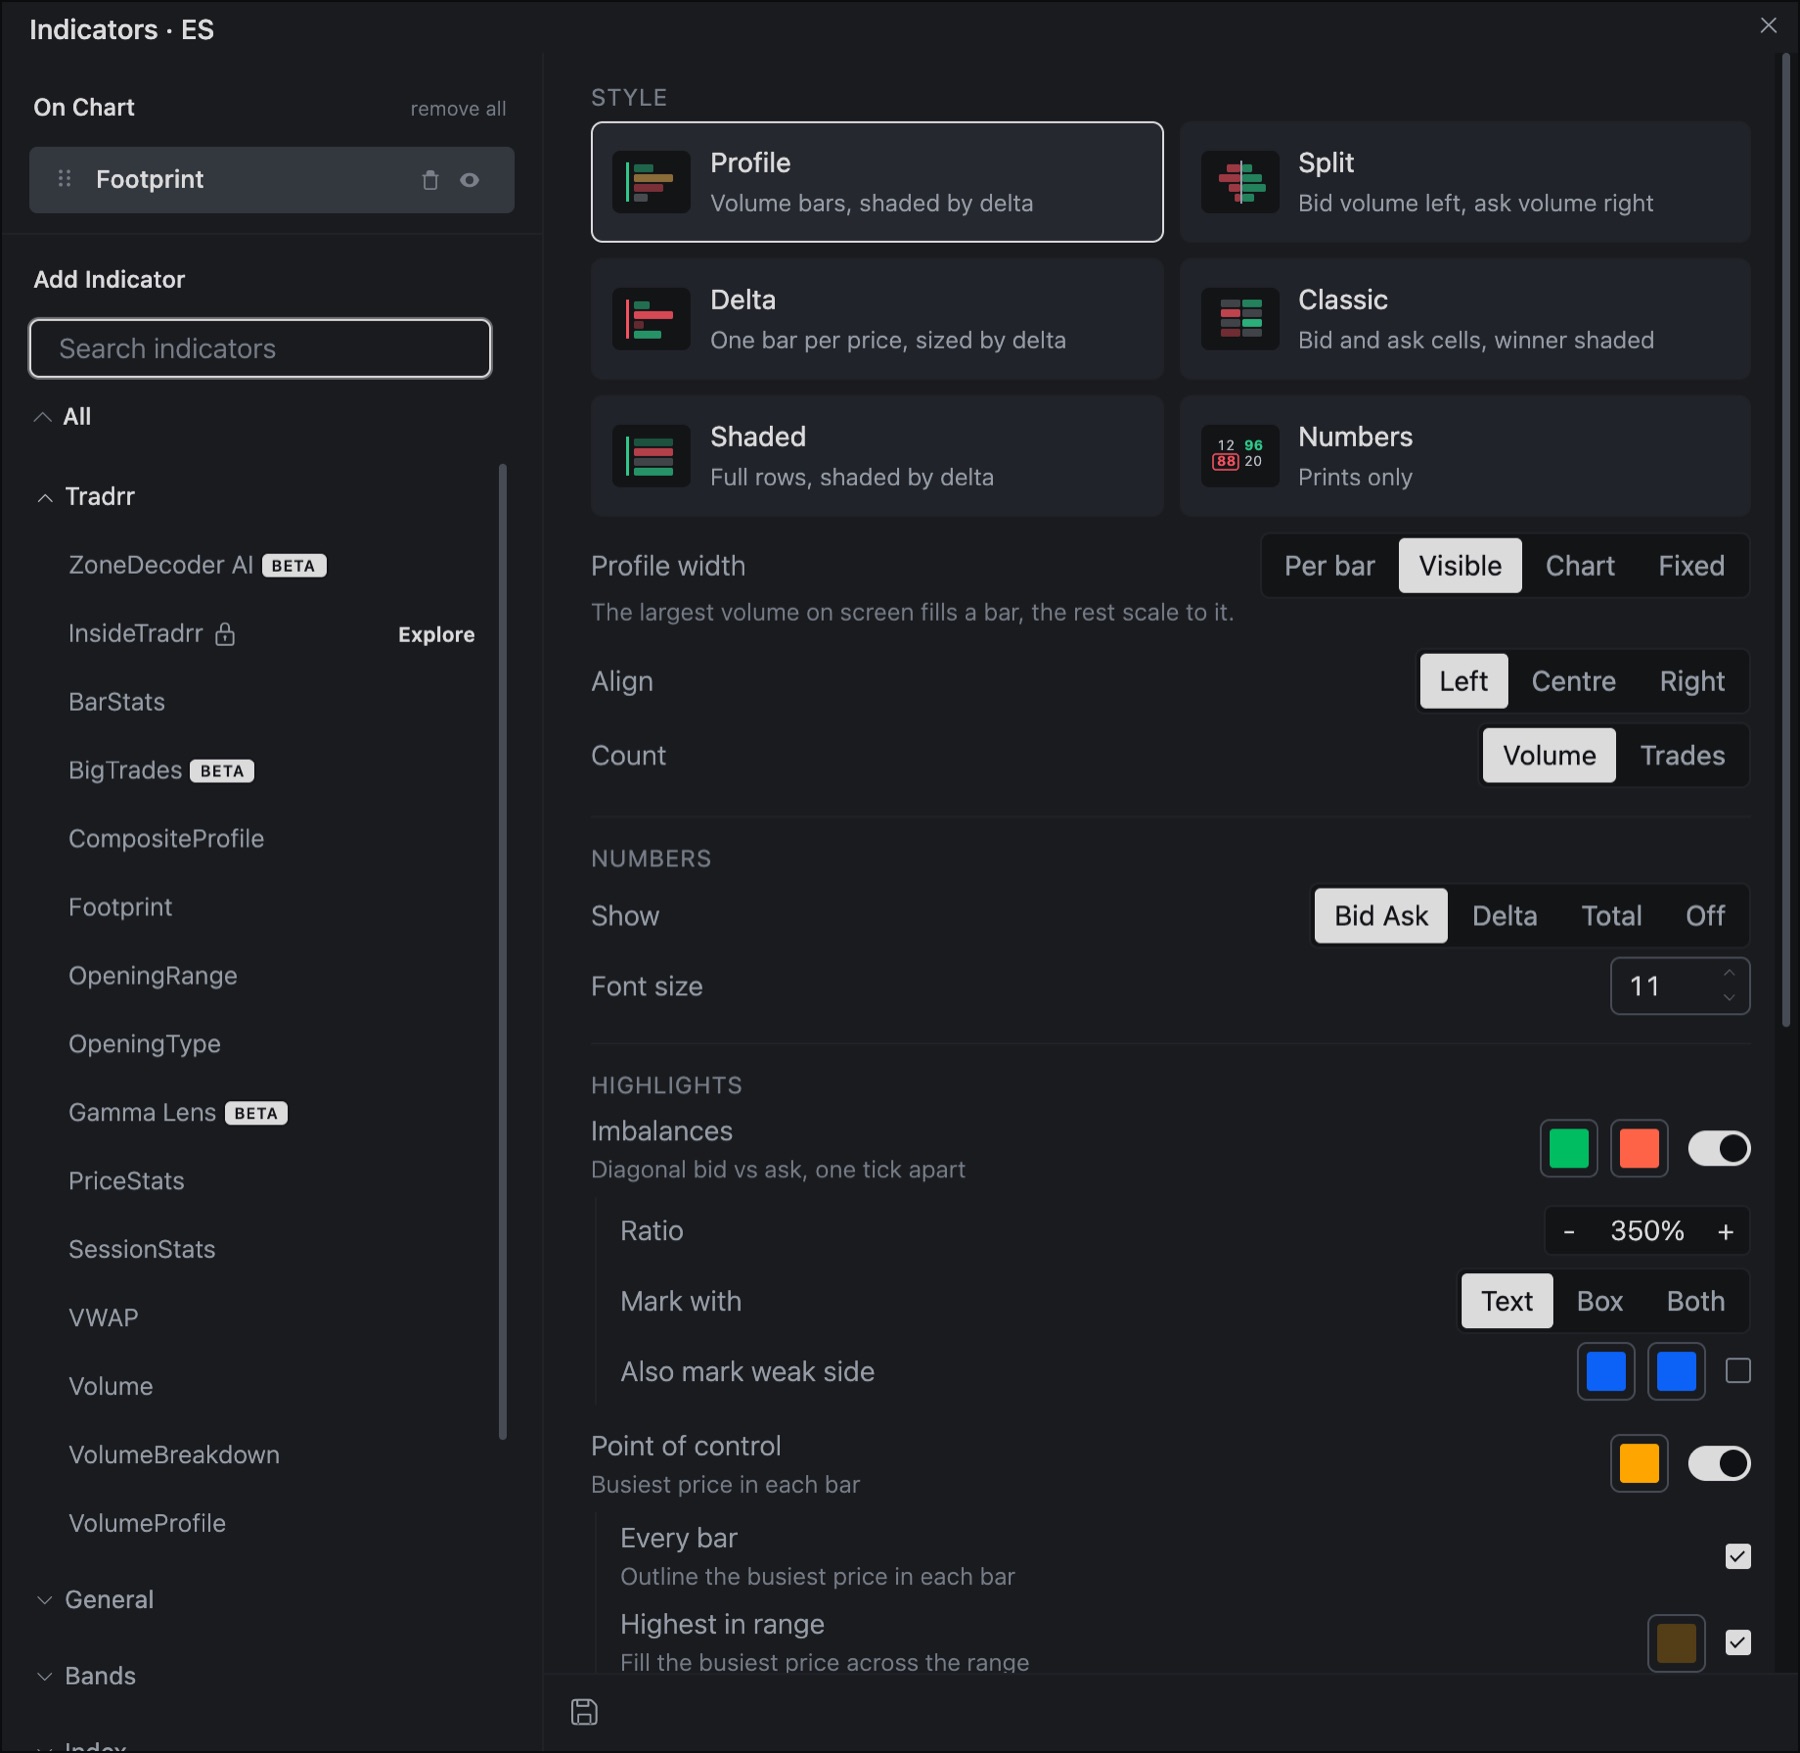
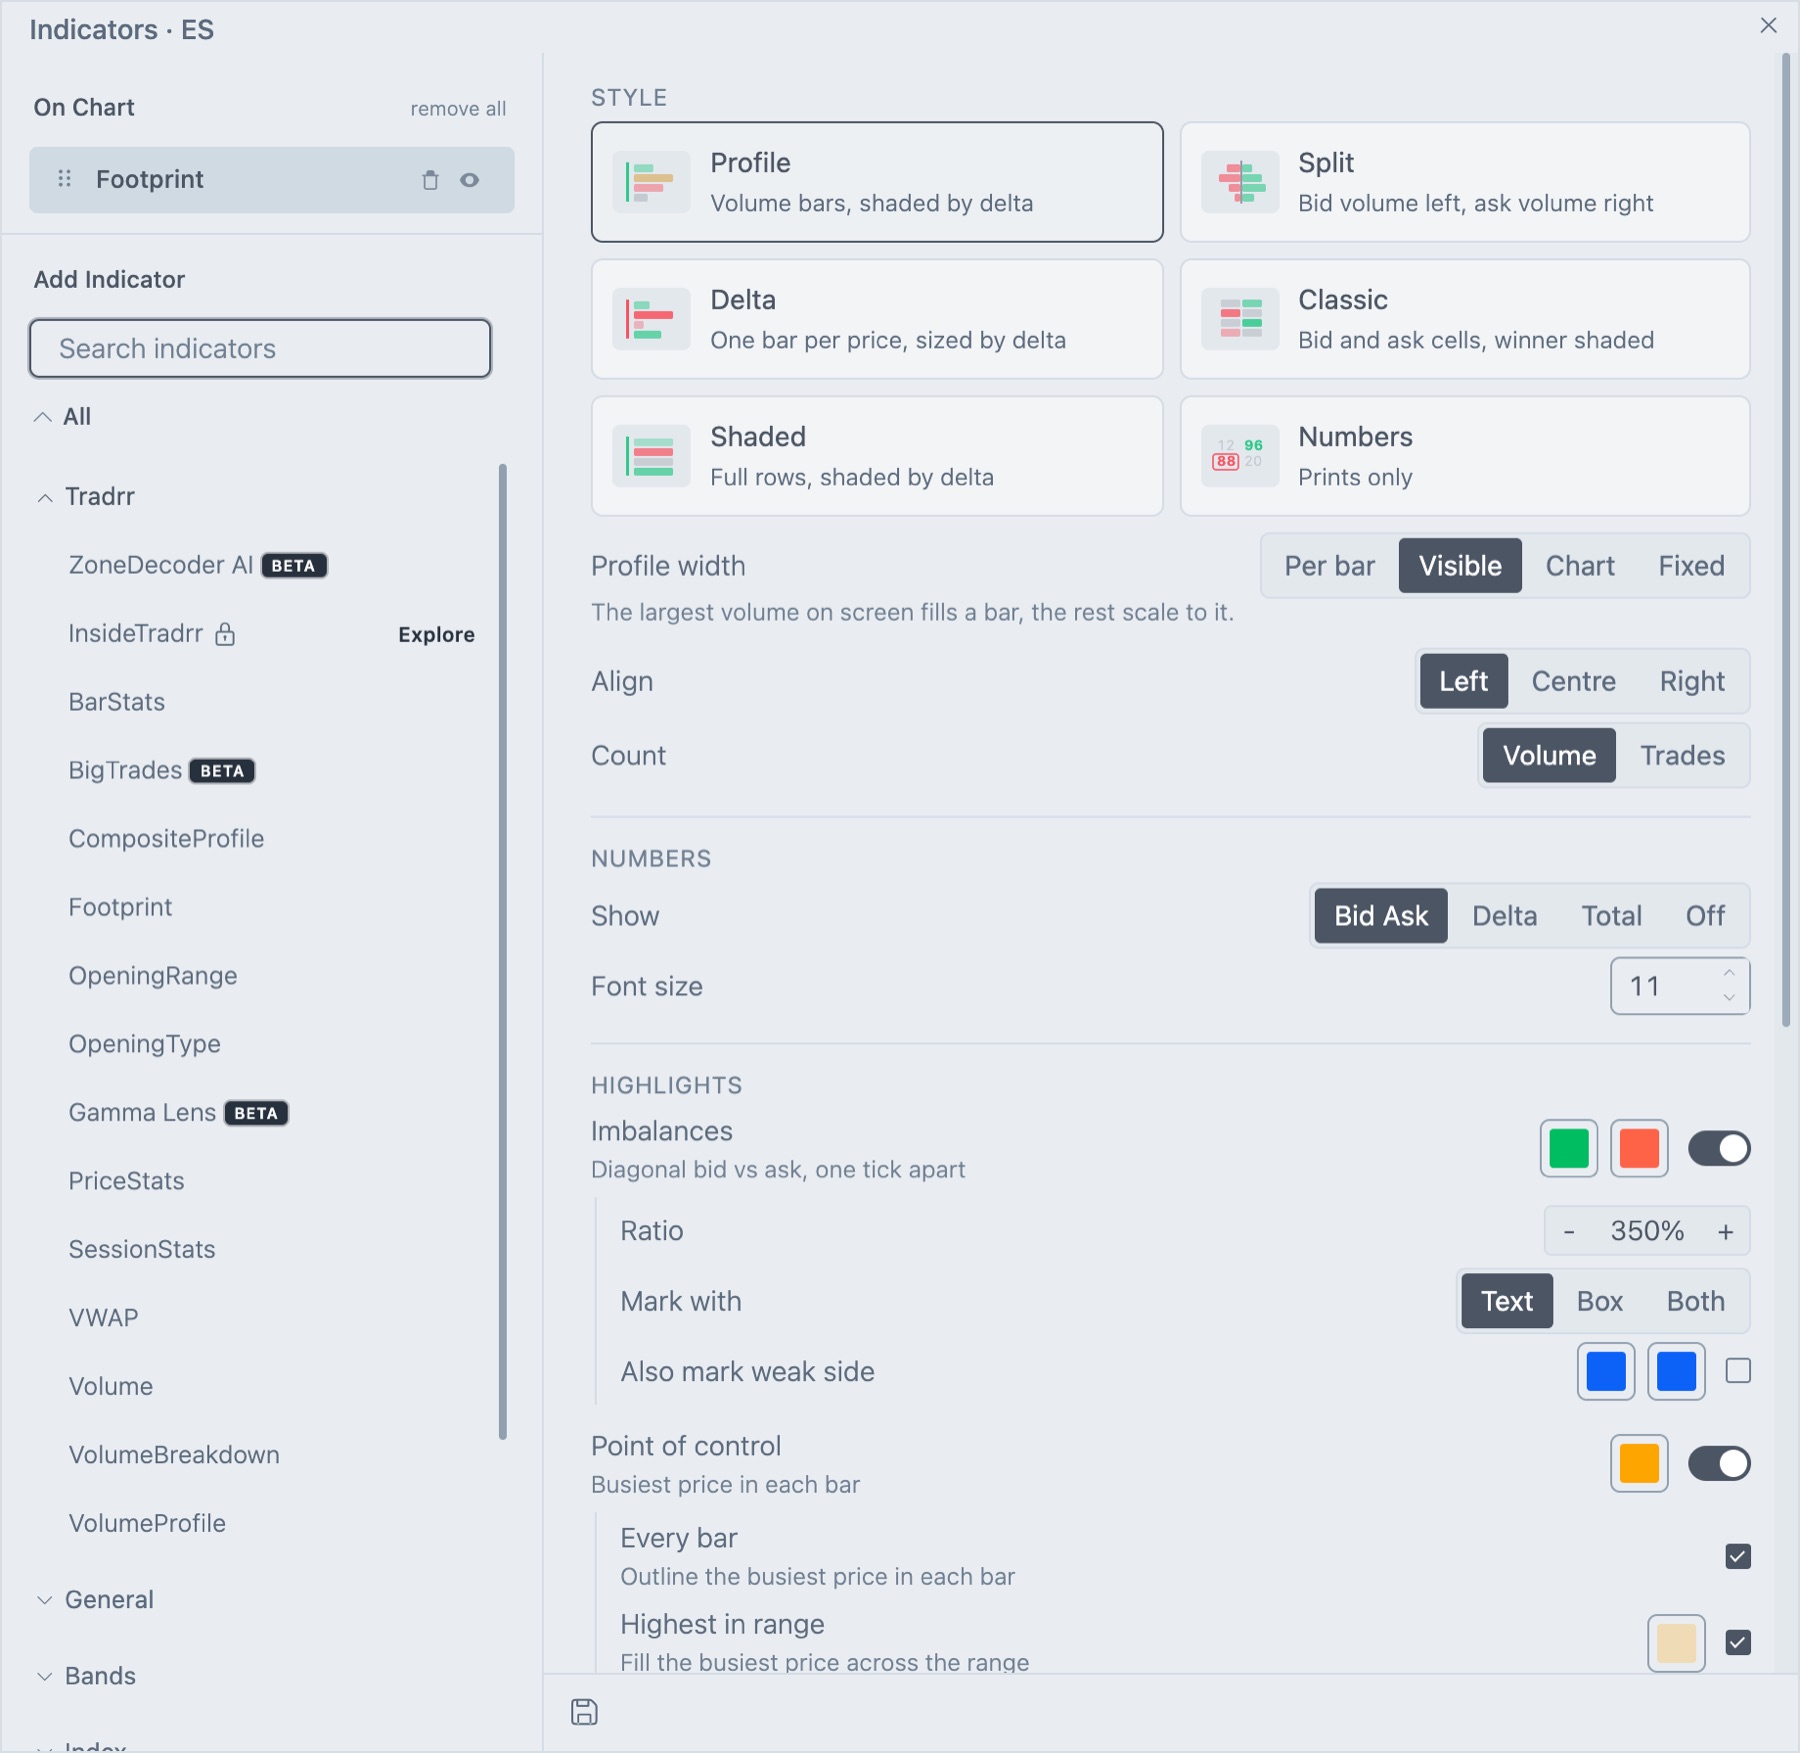
The settings are in sections: Style, Numbers, Highlights, Colours, Layout and Advanced. Advanced is closed until you click Show next to its title.
Style
Pick one of six cards. The chart changes right away.
| Card | What you get |
|---|---|
| Profile | Volume bars, shaded by delta. This is the default. |
| Split | Bid volume on the left, ask volume on the right. |
| Delta | One bar per price, sized by delta. |
| Classic | Bid and ask cells, with the winning side shaded. |
| Shaded | Full rows, shaded by delta. |
| Numbers | Prints only, no bars. |
| Setting | What it does | Default |
|---|---|---|
| Profile width | What a full-width bar stands for. Per bar: each bar's largest value fills the bar. Visible: the largest value on screen fills a bar and the rest scale to it. Chart: the largest value in all loaded bars fills a bar. Fixed: the value you set in Full width at fills a bar. Shown for Profile, Split and Delta. | Visible |
| Full width at volume | The volume that fills a bar when Profile width is Fixed. Reads Full width at delta on the Delta card. | 4000 |
| Align | Left, Centre or Right. Where the bars sit inside each cell. Shown for Profile only. | Left |
| Count | Volume counts contracts. Trades counts the number of trades. | Volume |
Numbers
| Setting | What it does | Default |
|---|---|---|
| Show | Bid Ask prints bid and ask. Delta prints bid, ask and the delta in the middle. Total prints bid, ask and the total in the middle. Off prints no numbers. | Bid Ask |
| Font size | Size of the numbers, minimum 1. The numbers shrink to fit short rows. | 11 |
Highlights
Each highlight is a switch, with its color boxes next to it.
| Setting | What it does | Default |
|---|---|---|
| Imbalances | Marks a price where one side beats the other side one tick away, diagonally. The two color boxes are the buy and the sell imbalance. | On |
| Ratio | How much bigger one side must be. Use - and + to move in steps of 50%, from 150% to 1000%. 350% means more than 3.5 times. | 350% |
| Mark with | Text colors the number. Box draws a box. Both does both. | |
| Also mark weak side | Check it to also mark the side that the other side beats by the ratio. It has its own two color boxes, for weak buy and weak sell. | Off |
| Point of control | Marks the busiest price. The color box sets its color. | On |
| Every bar | Outlines the busiest price in each bar. | On |
| Highest in range | Fills the busiest price across the range, in its own color. | On |
| Candle strip | A thin wick and body on the left of each bar. The two color boxes are candle up and candle down. | On |
| Last price outline | A box around the current price. One color box. | On |
Ratio, Mark with and Also mark weak side show only while Imbalances is on. Every bar and Highest in range show only while Point of control is on.
Colours
| Setting | What it does |
|---|---|
| Palette | Three one-click color sets: Green and red, Blue and red, and Teal and orange (colour-blind safe). A set changes the buy and sell bars, the imbalance colors and the candle strip together. Hover a swatch to read its name. |
| Buy bars, Sell bars | Shade colors for the buy and the sell side. |
| Neutral bars | Color of a bar when bid and ask are equal, or when Shade bars by delta is off. |
| Text | Color of the numbers. |
| Bar track | Fill behind each bar's cells. |
Layout
| Setting | What it does | Default |
|---|---|---|
| Bar spacing | Tight or Wide. The gap between neighboring bars. | Tight |
| Row gaps | A thin line between price rows. It only draws when rows are at least 10 pixels tall. | Off |
| Hide bars below volume | Draws no bar for a price with less volume than this. Hidden on the Numbers card. | 0 |
Advanced
Click Show next to Advanced to open it.
| Setting | What it does | Default |
|---|---|---|
| Font | Open Sans or Monospace. | Open Sans |
| Weight | Regular or Bold. | Regular |
| Text outline | Draws a thin halo around the numbers so they stay readable on the bars. | On |
| Shade bars by delta | Colors each bar by which side was bigger. Turn it off for plain bars. Shown for Profile and Shaded. | On |
| Starting bar width, px | Pixel width per bar the chart zooms to when you add Footprint or change this value. Minimum 1. | 80 |
| Hide numbers when bar is narrower than, px | Numbers hide when a bar is narrower than this. Minimum 1. | 60 |
| Hide numbers when row is shorter than, px | Numbers hide when a row is shorter than this. Minimum 5. | 5 |
| POC outline width, px | Line width of the point of control outline. Minimum 1. | 1 |
| Track outline, Cell outline | Outline colors for the bar track and for each cell. |
How traders read it
- Stacked imbalances: several strong colors in a row on one side show aggressive buying or selling pushing through levels.
- Point of control: the busiest price of a bar. Price often returns to it.
- Delta against price: a bar that closes higher with a negative delta shows buyers did not drive the move.
- Thin prices: rows with little volume at a bar's high or low show price was rejected quickly.
Tip. Footprint needs width. If the numbers are too small, widen the chart window, zoom in, or use the magnifier instead.
Related articles
Was this article helpful?