Opening Type
Opening Type reads the first minutes after the 09:30 New York open and labels how the session opened: Open Drive, Open Test Drive, Open Rejection Reverse or Open Auction. An info box then lists the likely path, what confirms it, what invalidates it and the first objectives.
- Shows
- Open classification, info box, gap boxes and levels
- Resets
- At each 09:30 New York open
- Best on
- Intraday time charts
What it measures
Opening Type compares the opening price and the early trade with the previous session's range. It scores each opening type and picks the best fit. The result starts as DEVELOPING, then changes to CONFIRMED or UNCLEAR as more bars arrive.
| Type | What the indicator looks for |
|---|---|
| Open Drive | One-way auction with little counter-rotation. |
| Open Test Drive | An initial test that is rejected, then a directional drive. |
| Open Rejection Reverse | An open outside the prior range that is rejected back through it. |
| Open Auction | Two-sided trade around the opening price. |
The info box shows a bias (BULLISH, BEARISH or NEUTRAL), the opening type, its state and a "classification evidence" score out of 100. The score says how well the open fits the type. It is not a probability that a trade will work.
The box also lists these rows:
- LIKELY PATH: where price should go if the type holds.
- CONFIRM: the price that confirms the read.
- INVALID: the price that cancels it.
- OBJECTIVE 1 and OBJECTIVE 2: nearby reference prices price may reach.
- Alternative: the other scenario to watch.
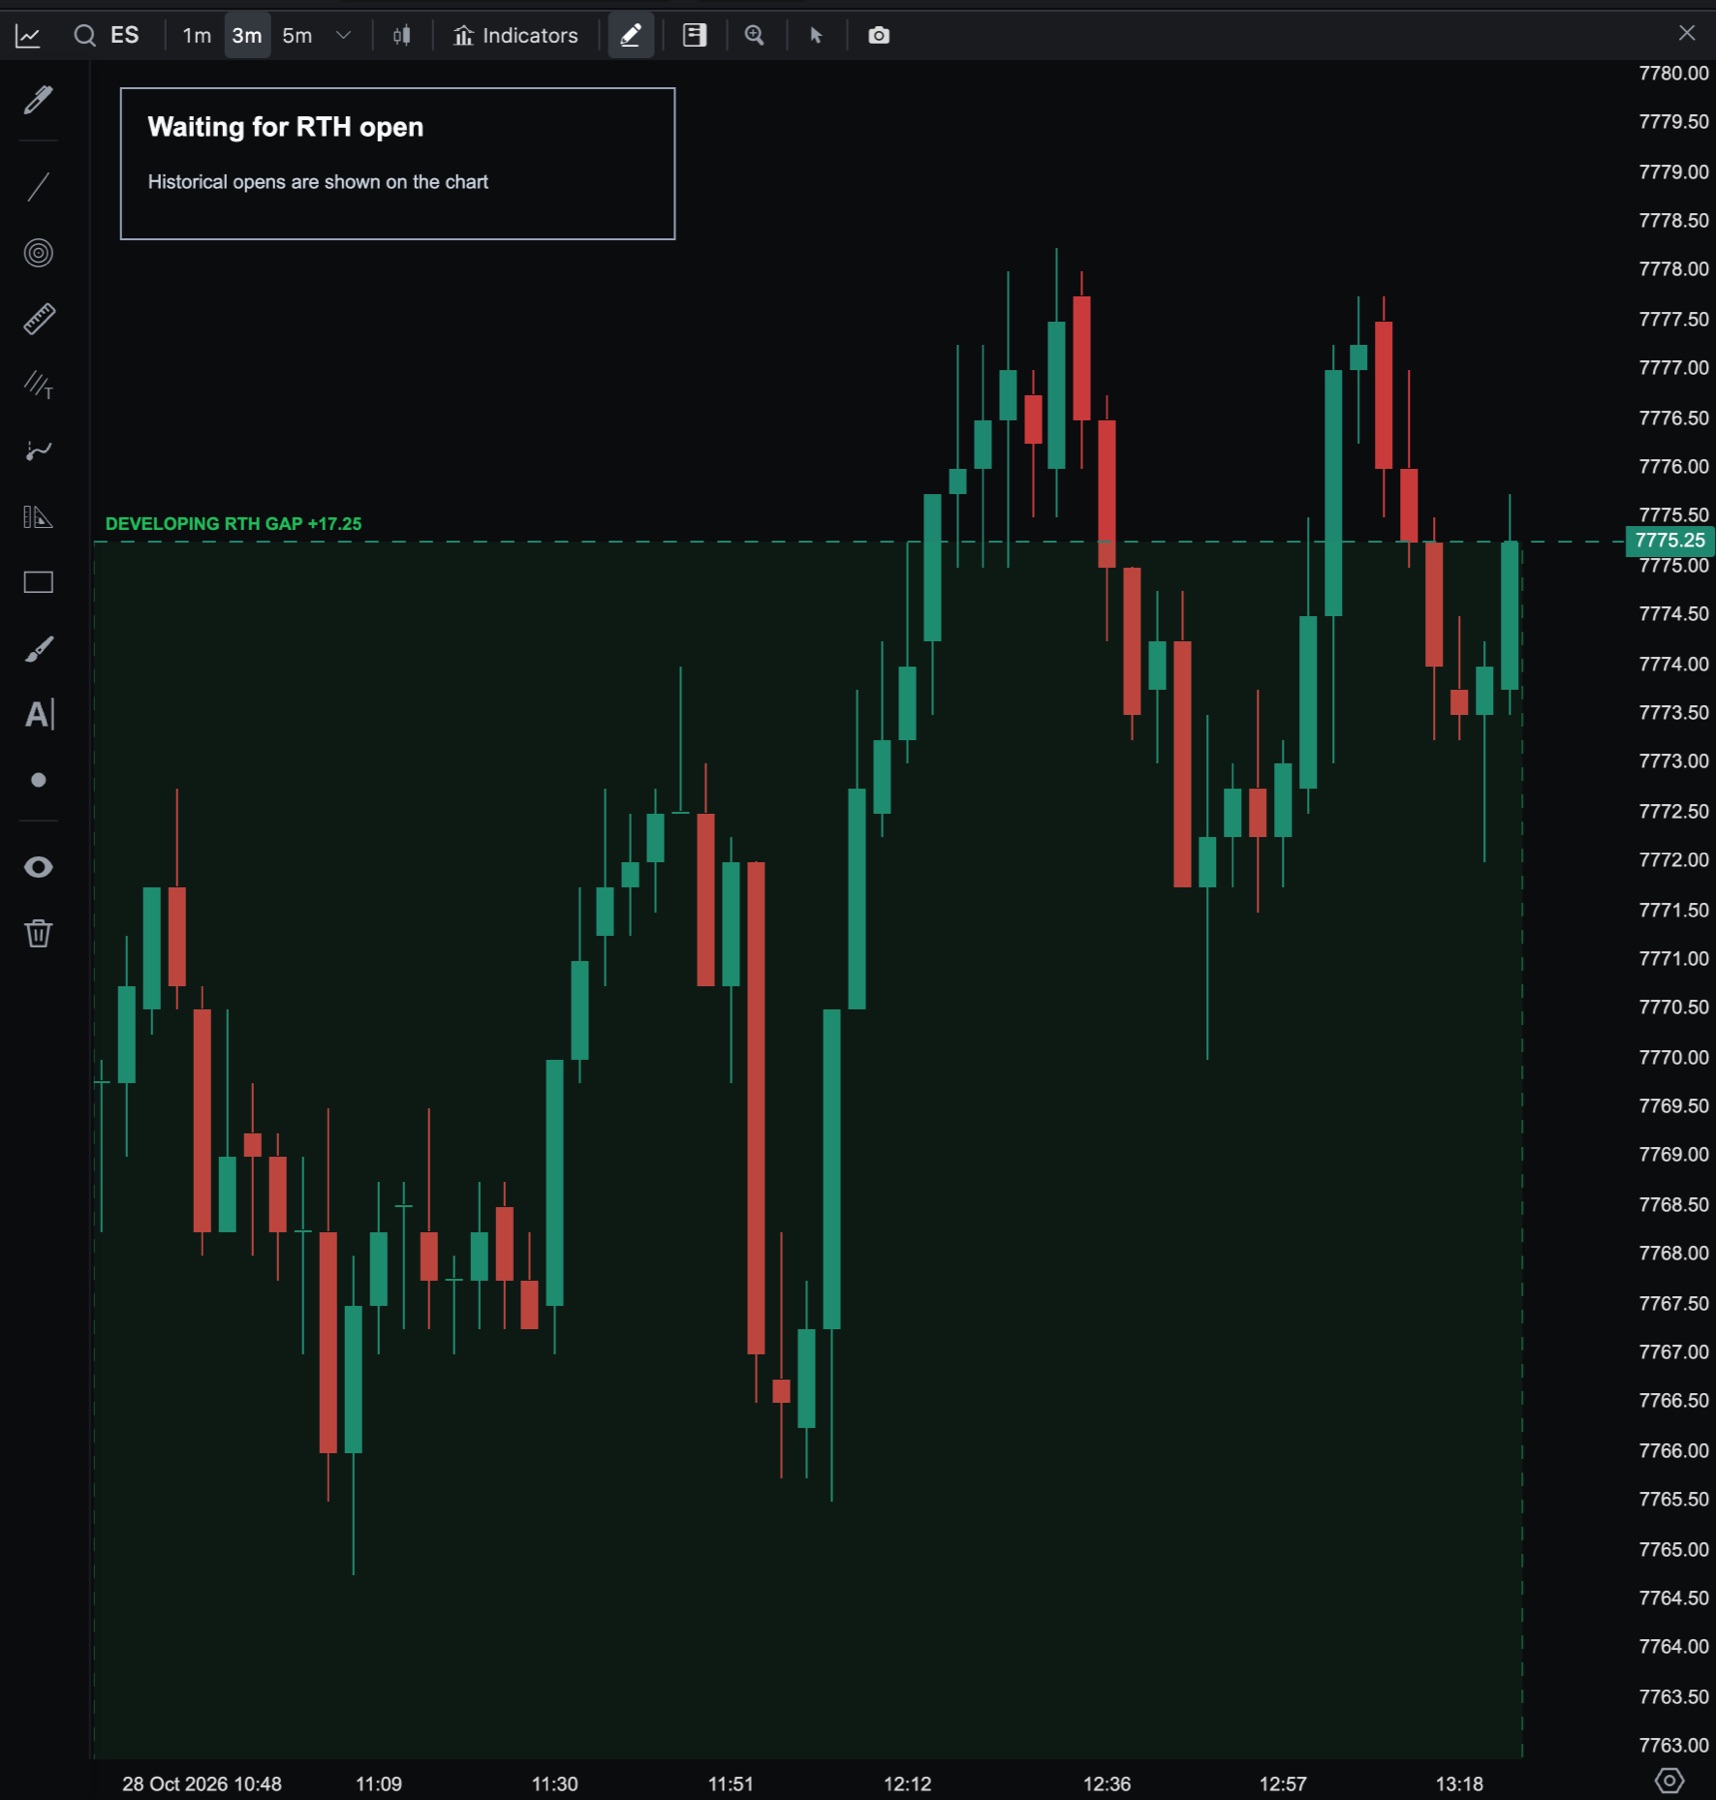
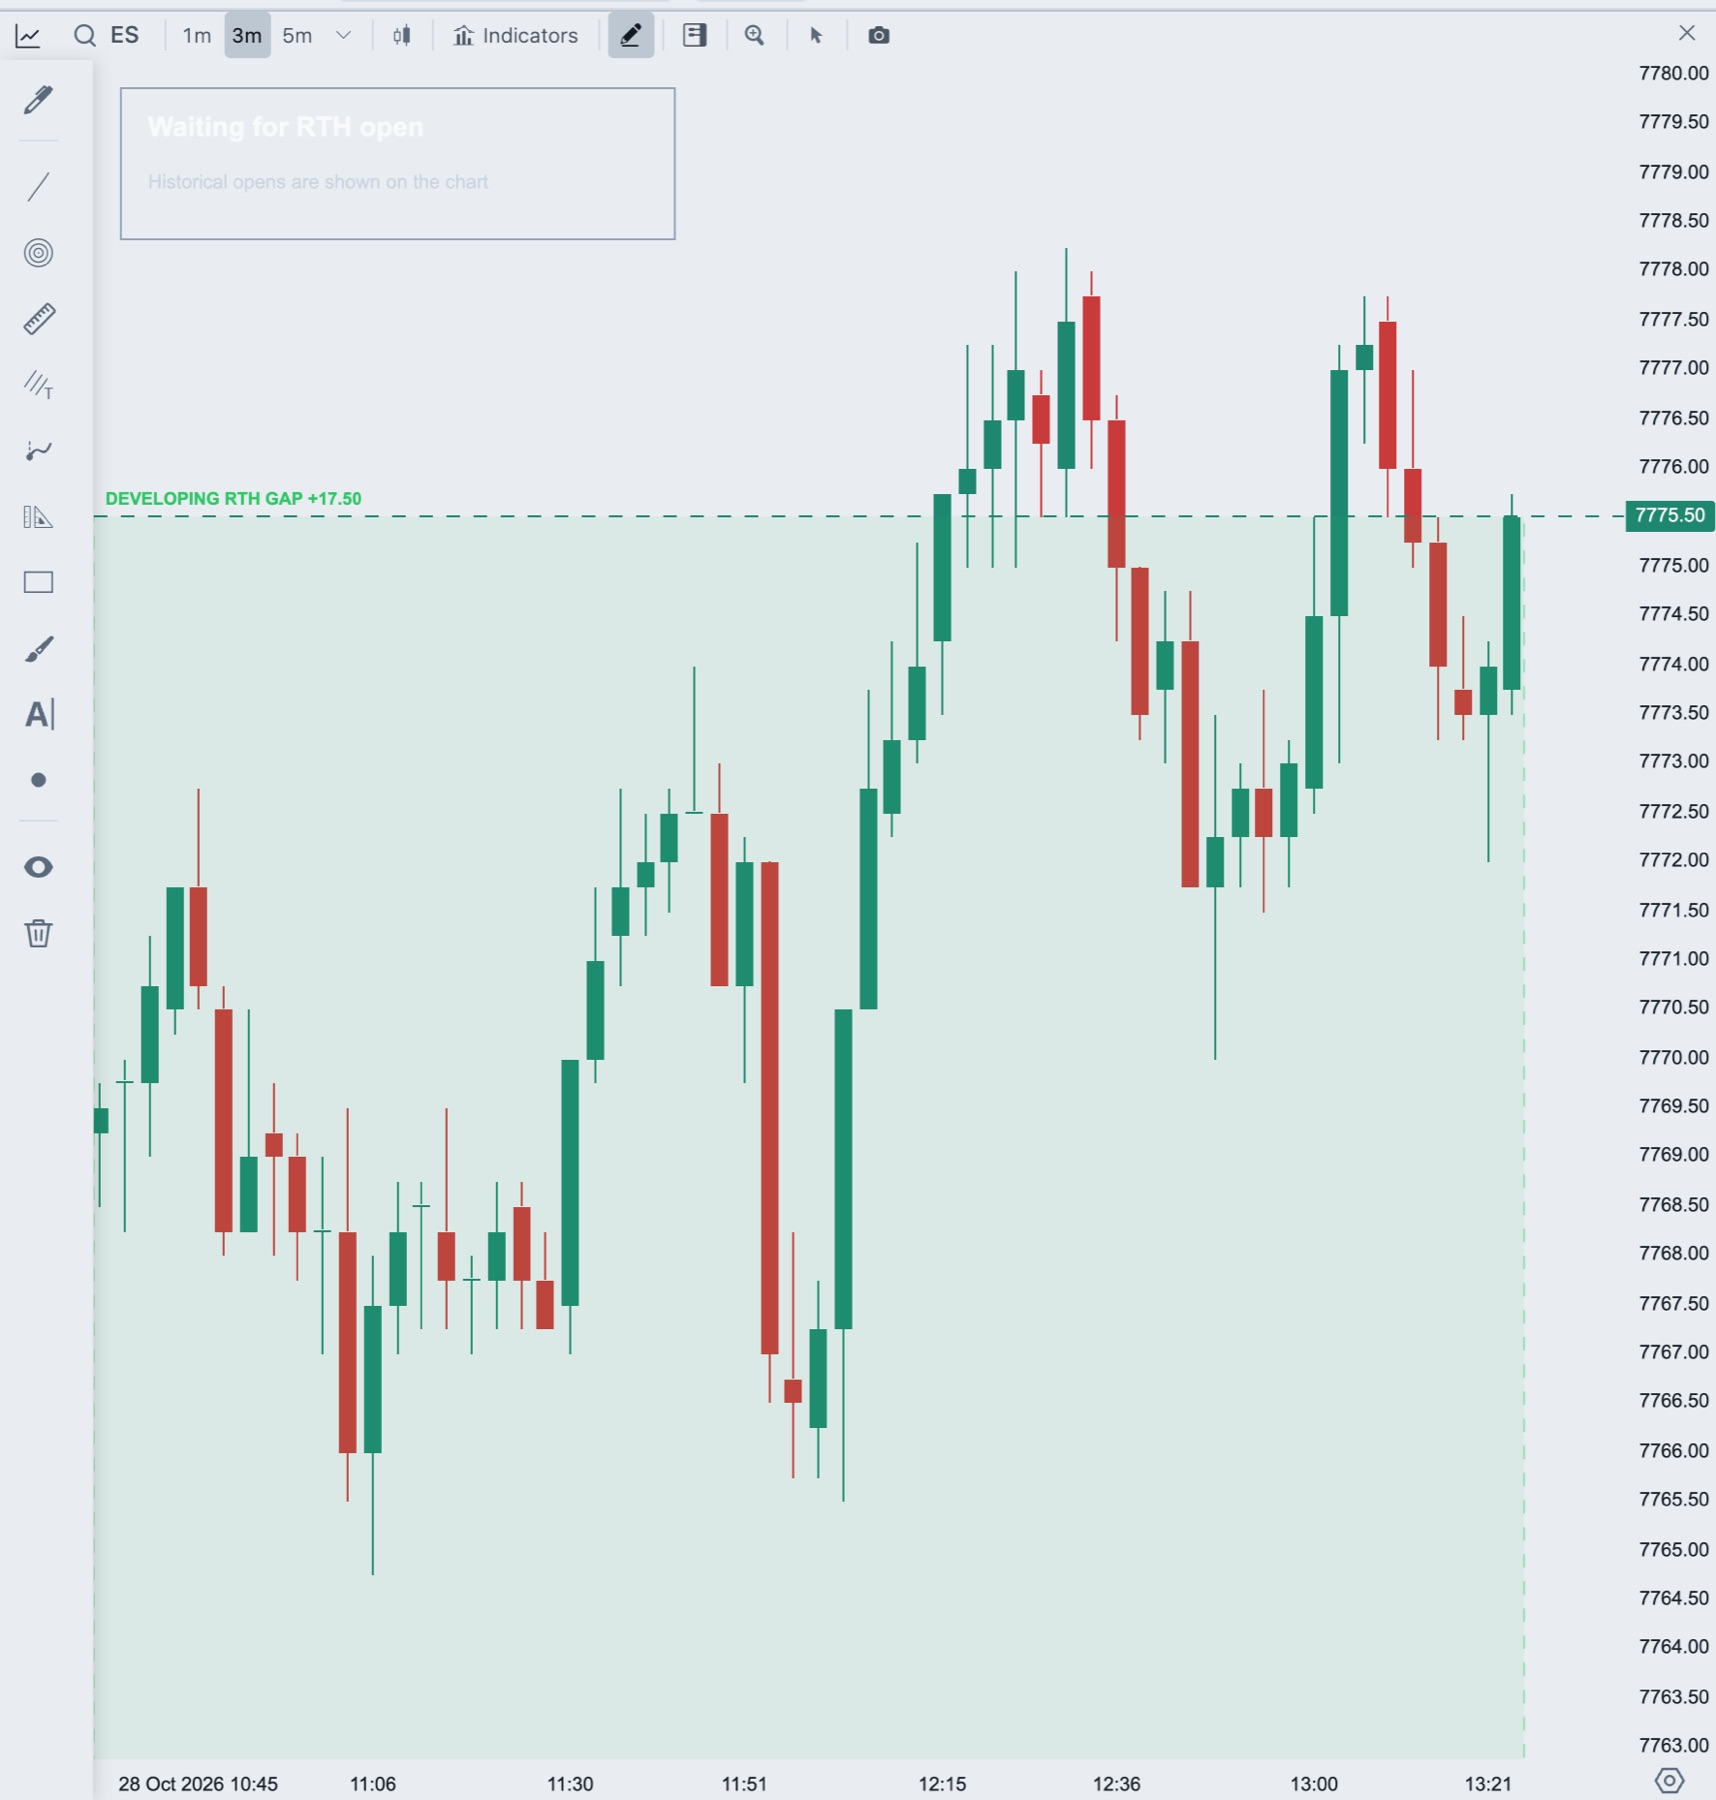
Before the open the box reads "Waiting for RTH open". The chart also marks the open with an RTH OPEN label and draws the confirmation, invalidation and objective levels. It shows the last 6 sessions.
Add Opening Type to a chart
- In the chart header, click Indicators.
- Under Add Indicator, type
OpeningTypein Search indicators, or open the Tradrr group. The name has no space. - Click OpeningType. It is added to the chart and its settings open on the right.
You can add one Opening Type to a chart.
Settings
OR Projections
| Setting | What it does | Default |
|---|---|---|
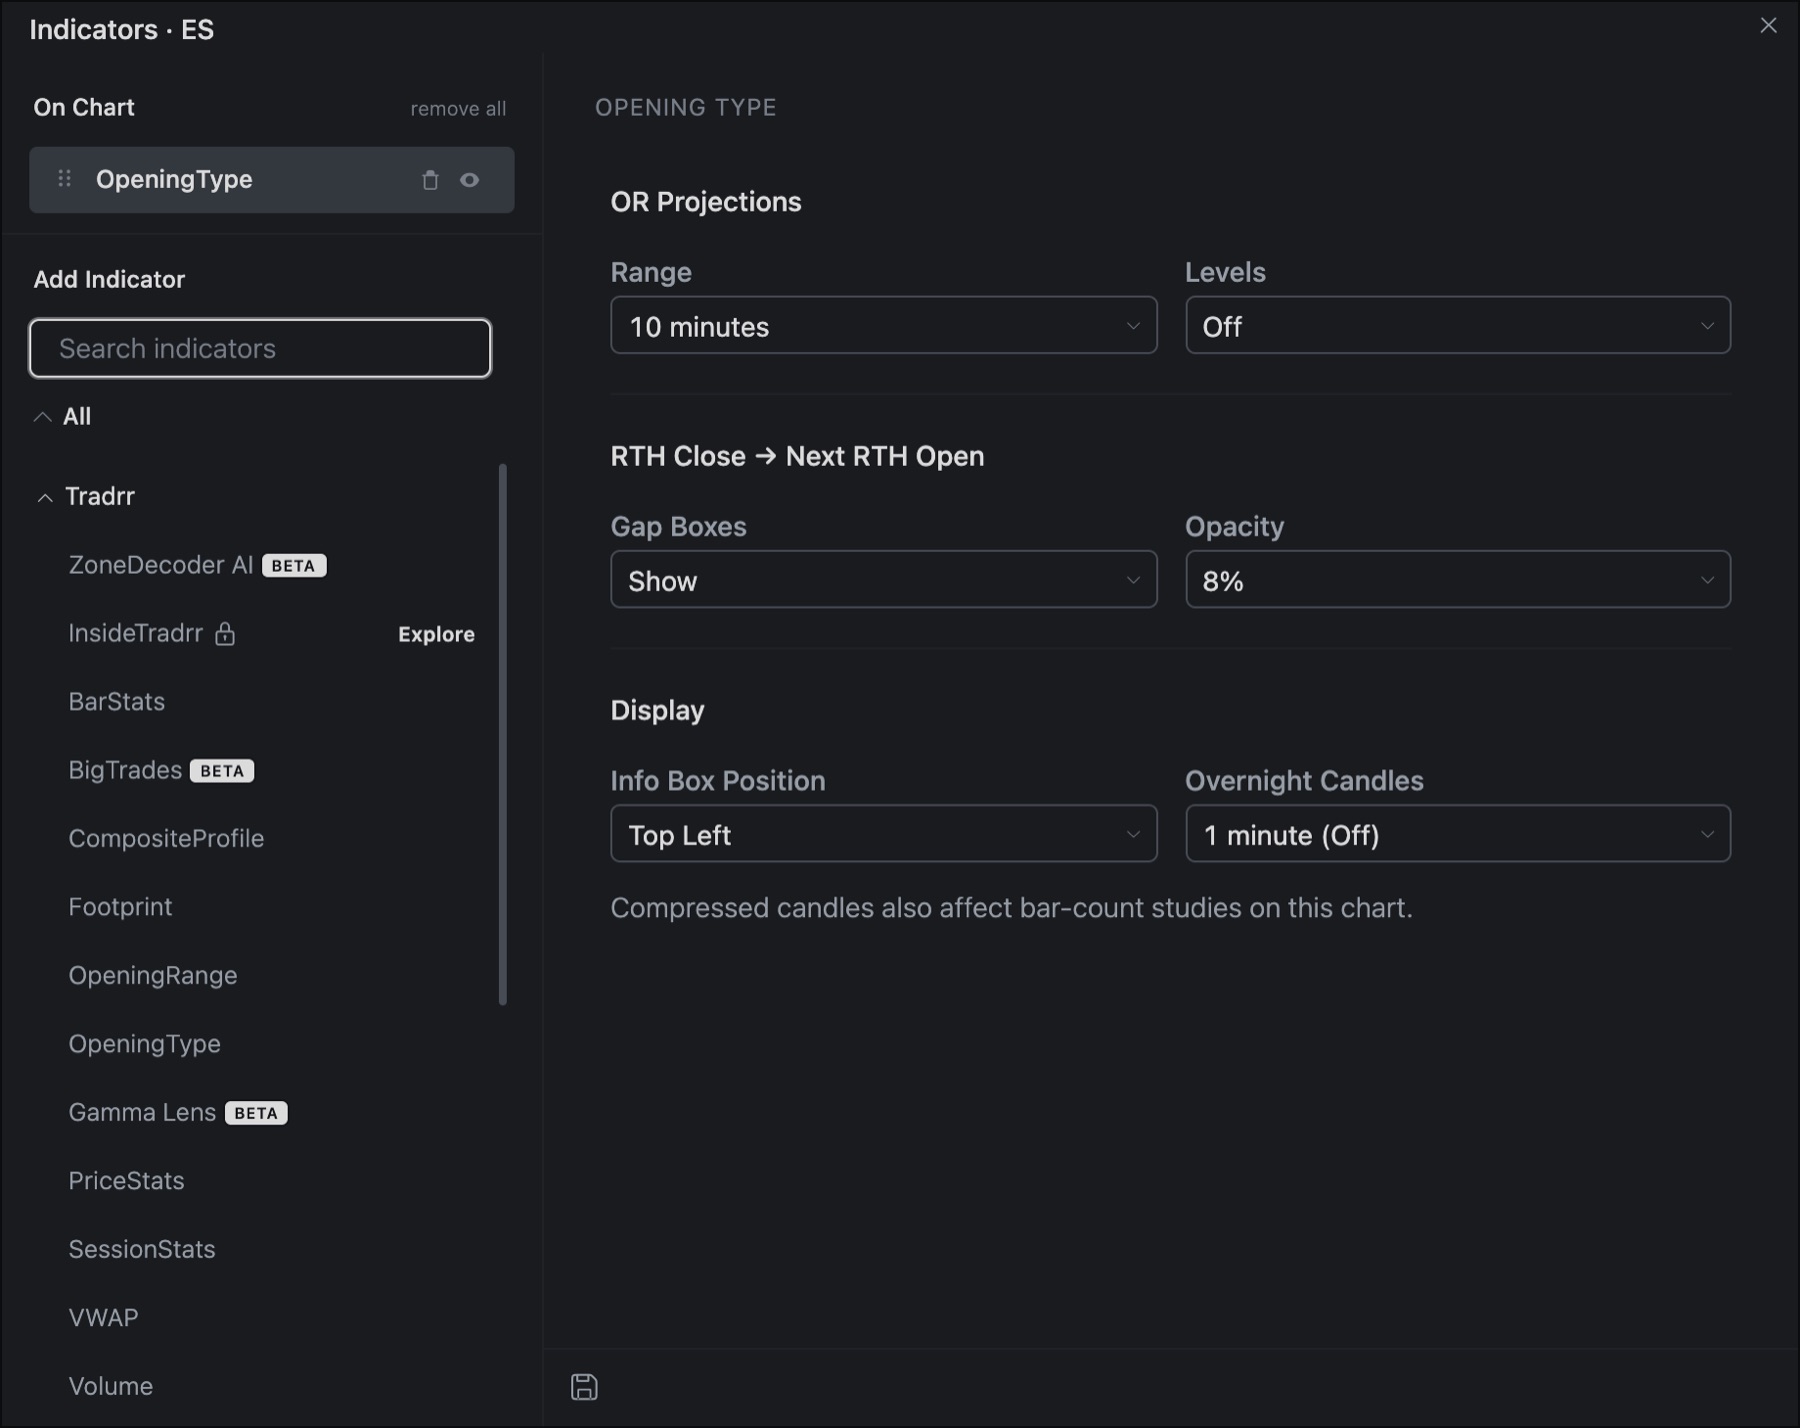
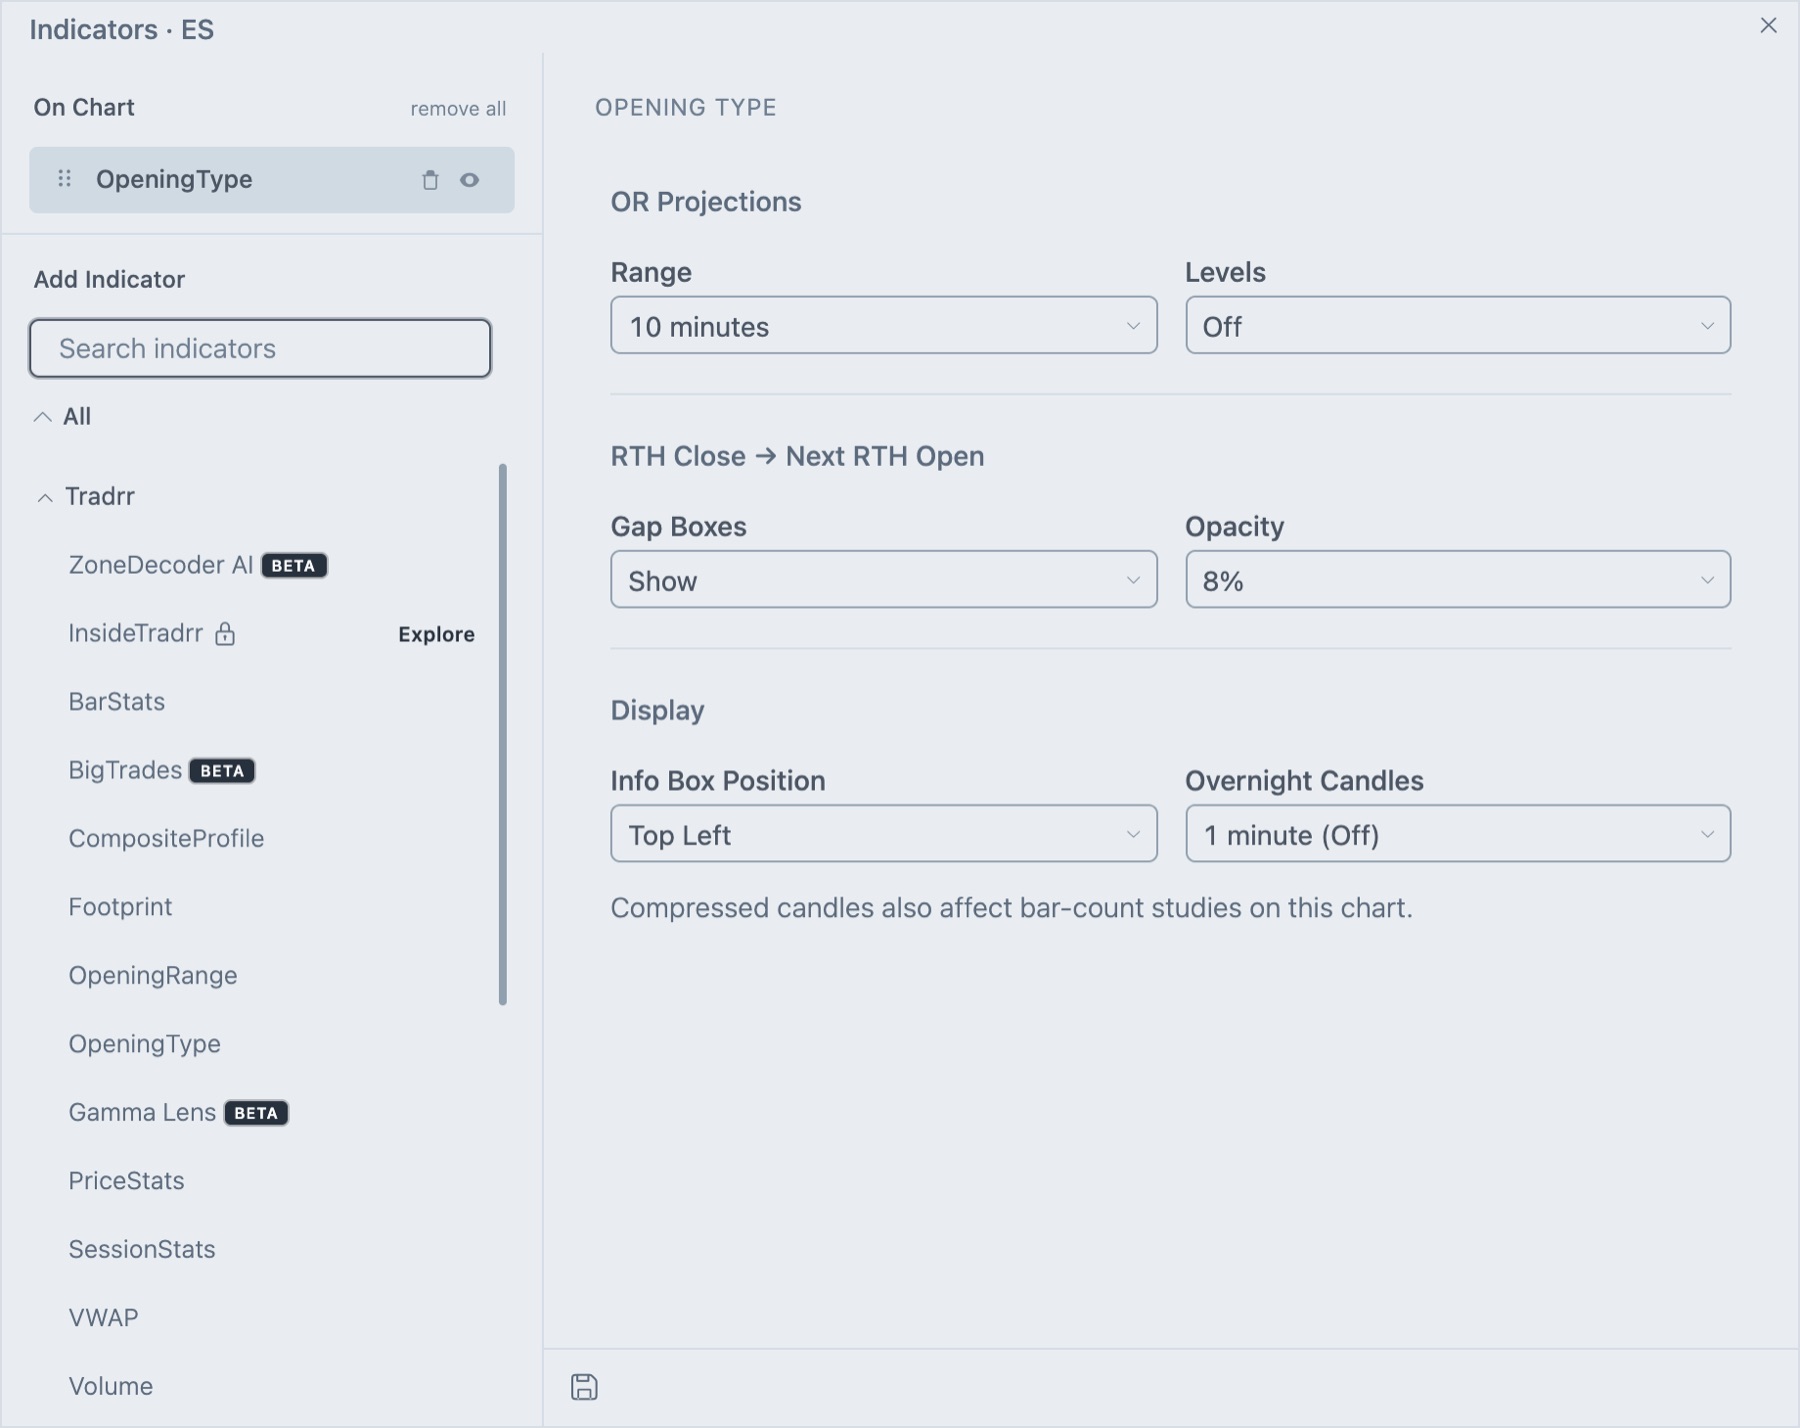
| Range | Length of the opening range in minutes: 5, 10, 15 or 30. | 10 minutes |
| Levels | Projects the opening range above and below it. Off, 1× or 1× and 2×. Labels read OR +1×, OR -1×, OR +2× and OR -2×. | Off |
RTH Close → Next RTH Open
| Setting | What it does | Default |
|---|---|---|
| Gap Boxes | Show or Hide a box between the RTH close and the next RTH open. Green boxes mark a gap up and red boxes a gap down. The label reads RTH GAP and the size. While the gap is still forming, the box is dashed and reads DEVELOPING RTH GAP. | Show |
| Opacity | Fill of the gap box: 5%, 8%, 12%, 16% or 20%. | 8% |
Display
| Setting | What it does | Default |
|---|---|---|
| Info Box Position | Top Left, Top Right, Bottom Left or Bottom Right. | Top Left |
| Overnight Candles | Shows overnight candles at the length you choose: 3 minutes, 5 minutes or 15 minutes. 1 minute (Off) leaves them as they are. | 1 minute (Off) |
Careful. Compressed overnight candles also affect bar-count studies on the same chart.
How traders read it
- Open Drive: the market moves one way from the first print. Traders often avoid fading it and look to join pullbacks.
- Open Test Drive: price tests one side, fails, then drives the other way. The test extreme is the level to respect.
- Open Rejection Reverse: the open is outside yesterday's range and gets sent back inside. A move toward the other side of that range is common.
- Open Auction: no clear control. The range is likely to hold until price accepts outside it.
Tip. Wait for CONFIRMED before treating the type as a signal. DEVELOPING and UNCLEAR reads can change as new bars print.
Related articles
Was this article helpful?